Category Archives: Bayesian Model Building

Frequentist & Bayesian Approaches to Regression Models by Hand – Compare and Contrast

One of the ways I try and learn things is to code them from first principles. It helps me see what is going on under the hood and also allows me wrap my head around how things work. Building regression models in R is incredibly easy using the lm() function and Bayesian regression models can be conveniently built with the same syntax in packages like {rstanarm} and {brms}. However, today I’m going to do everything by hand to get a grasp of how the Bayesian regression model works, at a very basic level. I put together the code using the mathematical presentation of these concepts from William Bolstad’s book, Introduction to Bayesian Statistics.

The entire script is available on my GITHUB page.

Loading Packages & Getting Data

I’m going to use the data from the {palmerpenguins} package and concentrate on a simple linear regression which will estimate flipper length from bill length.

### packages ------------------------------------------------------
library(tidyverse)
library(palmerpenguins)
library(patchwork)

theme_set(theme_classic())

### data ----------------------------------------------------------
data("penguins")
dat <- penguins %>%
  select(bill_length = bill_length_mm, flipper_length = flipper_length_mm) %>%
  na.omit()

head(dat)


EDA

These two variables share a relatively large correlation with each other.

Ordinary Least Squares Regression

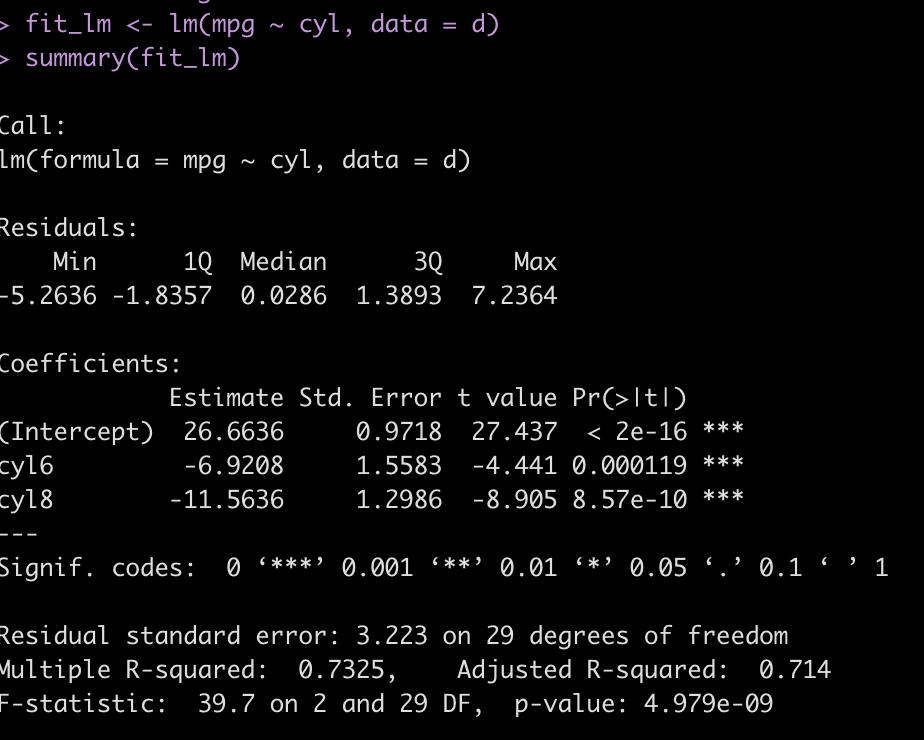
First, I’ll start by building a regression model under the Frequentist paradigm, specifying no prior values on the parameters (even though in reality the OLS model is using a flat prior, where all values are equally plausible — a discussion for a different time), using the lm() function.

### Ordinary Least Squares Regression ------------------------------
fit_ols <- lm(flipper_length ~ I(bill_length - mean(dat$bill_length)), data = dat)
summary(fit_ols)

Technical Note: Since we don’t observe a bill length of 0 mm in penguins, I chose to transform the bill length data by grand mean centering it — subtracting each bill length from the population mean. This wont change the predictions from the model but does change our interpretation of the coefficients themselves (and the intercept is now directly interpretable, which it wouldn’t be if we left the bill length data in its untrasnformed state).

OLS Regression by Hand

Okay, that was easy. In a single line we constructed a model and we are up and running. But, let’s calculate this by hand so we can see where the coefficients and their corresponding standard errors came from.

# Calculate the least squares regression line by hand now
dat_stats <- dat %>%
  summarize(x_bar = mean(bill_length),
            x_sd = sd(bill_length),
            y_bar = mean(flipper_length),
            y_sd = sd(flipper_length),
            r = cor(bill_length, flipper_length),
            x2 = x_bar^2,
            y2 = y_bar^2,
            xy_bar = x_bar * y_bar,
            .groups = "drop")

dat_stats

In the above code, I’m calculating summary statistics (mean and SD) for both the independent and dependent variables, extracting their correlation coefficient, and getting their squared means and the product of their squared means to be used in downstream calculations of the regression coefficients. Here is what the output looks like:

The model intercept is simply the mean of our outcome variable (flipper length).

intercept <- dat_stats$y_bar

The coefficient for our independent variable is calculated as the correlation coefficient multiplied by the the SD of the y variable divided by the SD of the x variable.

beta <- with(dat_stats,
             r * (y_sd / x_sd))

beta

Finally, I’ll store the grand mean of bill length so that we can use it when we need to center bill length and make predictions.

x_bar <- dat_stats$x_bar
x_bar

Now that we have the intercept and beta coefficient for bill length calculated by hand we can construct the regression equation:

Notice that these are the exact values we obtained from our model using the lm() function.

We can use the two models to make predictions and show that they are the exact same.

## Make predictions with the two models
dat %>%
  mutate(pred_model = predict(fit_ols),
         pred_hand = intercept + beta * (bill_length - x_bar))

In the model estimated from the lm() function we also get a sigma parameter (residual squared error, RSE), which tells us, on average, how off the model predictions are. We can build this by hand by first calculating the squared error of the observed values and our predictions and then calculating the RSE as the square root of the sum of squared residuals divided by the model degrees of freedom.

# Calculate the estimated variance around the line
N_obs <- nrow(dat) dat %>%
  mutate(pred = intercept + beta * (bill_length - x_bar),
         resid = (flipper_length - pred),
         resid2 = resid^2) %>%
  summarize(n_model_params = 2,
            deg_freedom = N_obs - n_model_params,
            model_var = sum(resid2) / deg_freedom,
            model_sd = sqrt(model_var))

Again, our by hand calculations equal exactly as what we obtained from the lm() function, 10.6.

Bayesian Linear Regression by Hand

Now let’s turn our attention to building a Bayesian regression model.

First we need to calculate the sum of squared error for X, which we do with this equation:

ss_x = N * (mean(mu_x^2) – mu_x^2)

N <- nrow(dat)
mean_x2 <- mean(dat$bill_length^2)
mu_x2 <- mean(dat$bill_length)^2

N
mean_x2
mu_x2

ss_x <- N * (mean_x2 - mu_x2)
ss_x

Next, we need to specify some priors on the model parameters. The priors can come from a number of courses. We could set them subjectively (usually people hate this idea). Or, we could look in the scientific literature and use prior research as a guide for plausible values of the relationship between flipper length and bill length. In this case, I’m just going to specify some priors that are within the range of the data but have enough variance around them to “let the data speak”. (NOTE: you could rerun the entire analysis with different priors and smaller or larger variances to see how the model changes. I hope to do a longer blog post about priors in the future).

  • For the slope coefficient we decide to have a normal prior, N(1, 2^2)
  • For the intercept coefficient we choose a normal prior, N(180, 10^2)
  • We don’t know the true variance so we use the estimated variance from the least squares regression line
prior_model_var <- sigma(fit_ols)^2

prior_slope_mu <- 1
prior_slope_var <- 1^2

prior_intercept_mu <- 180
prior_intercept_var <- 10^2

Next, we calculate the posterior precision (1/variance) for the slope coefficient. We do it with this equation:

1/prior_slope_var + (ss_x / prior_model_var)

And then convert it to a standard deviation (which is more useful to us and easier to interpret than precision, since it is on the scale of the data).

# 1/prior_slope_var + (ss_x / prior_model_var)
posterior_slope_precision <- 1 / prior_slope_var + ss_x / prior_model_var

# Convert to SD
posterior_slope_sd <- posterior_slope_precision^-(1/2)

Once we have the precision for the posterior slope calculated we can calculate the posterior regression coefficient for the slope using this equation:

(1/prior_slope_var) / posterior_slope_var * prior_slope_mu + (ss_x / prior_model_var) / posterior_slope_var * beta

# posterior slope
posterior_slope_mu <- (1/prior_slope_var) / posterior_slope_precision * prior_slope_mu + (ss_x / prior_model_var) / posterior_slope_precision * beta
posterior_slope_mu

We can plot the prior and posterior slope values, by first simulating the posterior slope using its mu and SD values.

## Plot prior and posterior for the slope
set.seed(4)
prior_sim <- rnorm(n = 1e4, mean = prior_slope_mu, sd = sqrt(prior_slope_var))
posterior_sim <- rnorm(n = 1e4, mean = posterior_slope_mu, sd = posterior_slope_sd)

plot(density(posterior_sim),
     col = "blue",
     lwd = 4,
     xlim = c(-2, 3),
     main = "Prior & Posterior\nfor\nBayesian Regression Slope Coefficient")
lines(density(prior_sim),
      col = "red",
      lty = 2,
      lwd = 4)
legend("topleft",
       legend = c("Prior", "Posterior"),
       col = c("red", "blue"),
       lty = c(2, 1),
       lwd = c(2,2))

We notice that the prior for the slope, N(1, 1^2), had a rather broad range of plausible values. However, after observing some data and combining that observed data with our prior, we find the posterior to have settled into a reasonable range given the value, Again, if you had selected other priors or perhaps a prior with a much narrower variance, these results would be different and potentially more influenced by your prior.

Now that we have a slope parameter we need to calculate the intercept. The equations are commented out in the code below.

## Posterior precision for the intercept
# 1/prior_intercept_var + N/prior_model_var

posterior_intercept_precision <- 1/prior_intercept_var + N/prior_model_var
posterior_intercept_precision

# Convert to SD
posterior_intercept_sd <- posterior_intercept_precision^-(1/2)
posterior_intercept_sd

## Posterior intercept mean
# (1/prior_intercept_var) / posterior_intercept_precision * prior_intercept_mu + (N/prior_model_var) / posterior_intercept_precision * intercept
posterior_intercept_mu <- (1/prior_intercept_var) / posterior_intercept_precision * prior_intercept_mu + (N/prior_model_var) / posterior_intercept_precision * intercept
posterior_intercept_mu

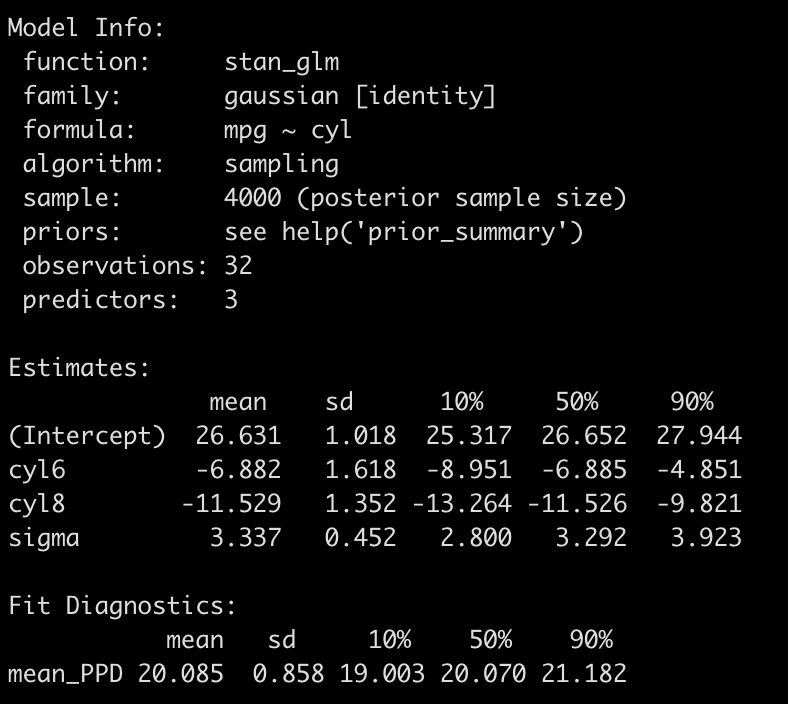
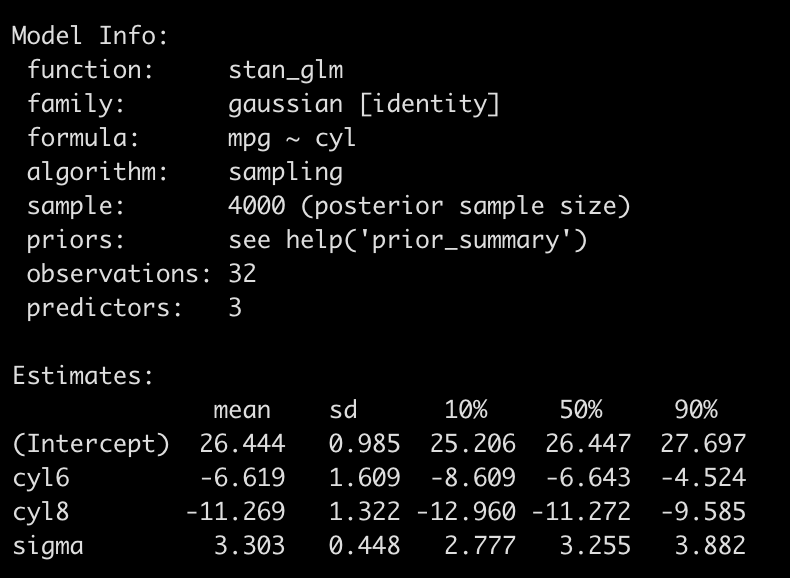
Comparing our Bayesian regression coefficients and standard errors to the ones we obtained from the lm() function, we find that they are nearly identical.

Using the coefficients and their corresponding standard errors we can also compare the 95% Credible Interval from the Bayesian model to the 95% Confidence Interval from the OLS model (again, nearly identical).

And writing out the Bayesian model we see that it is the same as the Frequentist model.

Using the posterior mean and SDs for the slope and intercept we can simulate a distribution and plot and summarize them using quantile intervals and credible intervals, to get a picture of our uncertainty.

## Use simulation for the slope and intercept
set.seed(413)
posterior_intercept_sim <- rnorm(n = 1e4, mean = posterior_intercept_mu, sd = posterior_slope_sd)
posterior_slope_sim <- rnorm(n = 1e4, mean = posterior_slope_mu, sd = posterior_slope_sd)

par(mfrow = c(1, 2))
hist(posterior_intercept_sim)
hist(posterior_slope_sim)

Making Predictions

Now that we have our models specified it’s time to make some predictions!

## Add all predictions to the original data set
dat_final <- dat %>%
  mutate(pred_ols = predict(fit_ols),
         pred_ols_by_hand = intercept + beta * (bill_length - x_bar),
         pred_bayes_by_hand = posterior_intercept_mu + posterior_slope_mu * (bill_length - x_bar))

head(dat_final, 10)

Because the equations were pretty much identical we can see that all three models (OLS with lm(), OLS by hand, and Bayes by hand) produce the same predicted values for flipper length.

We can also visualize these predictions along with the prediction intervals.

## Predictions with uncertainty from the OLS model
ols_preds <- dat_final %>%
  bind_cols(predict(fit_ols, newdata = ., interval = "prediction")) %>%
  ggplot(aes(x = fit, y = flipper_length)) +
  geom_point(size = 2) +
  geom_ribbon(aes(ymin = lwr, ymax = upr),
              alpha = 0.4) +
  geom_smooth(method = "lm",
              se = FALSE) +
  ggtitle("OLS Predictions with 95% Prediction Intervals")

## Now predict with the Bayesian Model
# The error is calculated as:
# residual_variance = prior_model_var +  posterior_intercept_sd^2 + posterior_slope^2*(x - x_bar)
bayes_preds <- dat %>%
  mutate(fit = posterior_intercept_mu + posterior_slope_mu * (bill_length-x_bar),
         error_var = prior_model_var + posterior_intercept_sd^2 + posterior_slope_sd^2 * (bill_length - x_bar),
         rse = sqrt(error_var),
         lwr = fit - qt(p = 0.975, df = N - 2) * rse,
         upr = fit + qt(p = 0.975, df = N - 2) * rse) %>%
  ggplot(aes(x = fit, y = flipper_length)) +
  geom_point(size = 2) +
  geom_ribbon(aes(ymin = lwr, ymax = upr),
              alpha = 0.4) +
  geom_smooth(method = "lm",
              se = FALSE) +
  ggtitle("Bayesian Predictions with 95% Prediction Intervals")


ols_preds | bayes_preds

Okay, I know what you are thinking. The equations were the same, the predictions are the same, and the prediction intervals are the same….What’s the big deal?!

The big deal is that the Bayesian model gives us more flexibility. Not only can we specify priors, allowing us to have a higher weighting on more plausible values (based on prior data, prior research, domain expertise, etc.); but, we can also produce an entire posterior distribution for the predictions.

Let’s take a single row of observation from the data and make a prediction on it, complete with 95% credible intervals, using our Bayesian model.

single_obs <- dat %>% slice(36)
single_obs

pred_bayes <- single_obs %>%
  mutate(fit = posterior_intercept_mu + posterior_slope_mu * (bill_length-x_bar),
         error_var = prior_model_var + posterior_intercept_sd^2 + posterior_slope_sd^2 * (bill_length - x_bar),
         rse = sqrt(error_var),
         lwr = fit - qt(p = 0.975, df = N - 2) * rse,
         upr = fit + qt(p = 0.975, df = N - 2) * rse) 

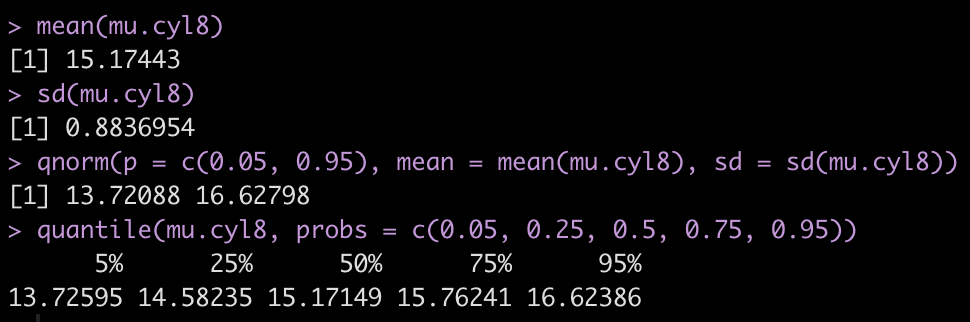
Next, we simulate 10,000 observations using the mean prediction (fit) and the rse from the table above and summarize the results

set.seed(582)
pred_bayes_sim <- rnorm(n = 1e4, mean = pred_bayes$fit, sd = pred_bayes$rse)

mean(pred_bayes_sim)
quantile(pred_bayes_sim, probs = c(0.5, 0.025, 0.975))
mean(pred_bayes_sim) + qt(p = c(0.025, 0.975), df = N - 2) * sd(pred_bayes_sim)

Our mean value, the 95% quantile intervals, and then 95% credible intervals are the similar to the table above (they should be since we simulated with those parameters). We will also get similar values if we use our OLS model and make a prediction on this observation with prediction intervals.

But, because we simulated a full distribution, from the Bayesian prediction we also get 10,000 plausible values for the estimate of flipper length based on the observed bill length.

This offers us flexibility to make more direct statements about the predictive distribution. For example, we might ask, “What is the probability that the predicted flipper length is greater than 210 mm?” and we could directly compute this from the simulated data! This provides us with a number of options if we were using this model to make decisions on and perhaps have threshold values or ranges of critical importance where we need to know how much of the density of our predicted distribution is below or above the threshold or falls outside of the region of importance.

Wrapping Up

That’s a little bit on working with regression models by hand, from first principles. The Bayesian approach affords us a lot of control and flexibility over the model, via priors (more on that in a future blog post) and the predictions (via simulation). The Bayesian regression model calculated here was a simple approach and did not require Markov Chain Monte Carlo (MCMC), which would be run when using {rstanarm} and {brms}. If you are curious how this works, I wrote a previous blog on using a GIBBS Sampler to estimate the posterior distributions for a regression model, CLICK HERE. But, even with this simple approach we are afforded the ability to specify priors on the model parameters of the deterministic/fixed component of the model. We did not specify a prior on the stochastic/error part of the model (we used the sigma value calculated from the OLS model — which we also calculated by hand). This was necessary in this simple conjugate approach because the normal distribution is a two parameter distribution so we needed to treat one of the parameters as fixed (in this case the SD). Had we used an MCMC approach, we could have further specified a prior distribution on the model error.

If you notice any errors, feel free to drop me an email.

The code is available on my GITHUB page.

Bayes Theorem: p(A|B) = p(A) * p(B|A) / p(B) — But why?

A student recently asked me if I could show them why Bayes Theorem looks the way it does. If we are trying to determine the probability A given B, how did we arrive at the theorem in the title?

Let’s create some data and see if we can sort it out. We will simulate a 2×2 table, similar to one we might find in sports medicine journals when looking at some type of test (positive or negative) and some type of outcome (disease or no disease).

dat_tbl <- data.frame(
  test = c("positive", "negative", "total"),
  disease = c(25, 5, 30),
  no_disease = c(3, 40, 43),
  total = c(28, 45, 73)
)

dat_tbl

A logical question we’d like to answer here is, “What is the probability of disease given a positive test.” Written in probability notation we are asking, p(Disease | Positive).

Using the data in the table, we can quickly compute this as 25 people who were positive and had the disease divided by 28 total positive tests. 25/28 = 89.3%

Of course, we could also compute this using Bayes Theorem:

p(Disease | Positive) = p(Disease) * p(Positive | Disease) / p(Positive)

We store the necessary values in R objects and then compute the result

### What we want to know: p(Disease | Positive)
# p(Disease | Positive) = p(Disease) * p(Positive | Disease) / p(Positive)
# p(A | B) = p(A) * p(B|A) / p(B)

p_disease <- 30/73
p_positive_given_disease <- 25/30
p_positive <- 28/73

p_no_disease <- 43/73
p_positive_given_no_disease <- 3/43

p_disease_given_positive <- (p_disease * p_positive_given_disease) / (p_disease * p_positive_given_disease + p_no_disease * p_positive_given_no_disease) 
p_disease_given_positive

This checks out. We get the exact same result as when we did 25/28.

Okay, how did we get here? Why does it work out like that?

The math works out because we start with two different joint probabilities, p(A n B) and p(B n A). Or, in our case, p(Disease n Positive) and p(Positive n Disease). Formally, we can write these as follows:

We’ve already stored the necessary probabilities in specific elements, above. But here it what they both look like using our 2×2. First I’ll calculate it with the counts directly from the table and then calculate it with the R elements that we stored. You’ll see the answers are the same.

## Joint Probability 1: p(Positive n Disease) = p(Positive | Disease) * p(Disease)

25/30 * 30/73

p_positive_given_disease * p_disease

## Joint Probability 2: p(Disease n Positive) = p(Disease | Positive) * p(Positive)

25/28 * 28/73

p_disease_given_positive * p_positive

Well, would you look at that! The two joint probabilities are equal to each other. We can formally test that they are equal to each other by setting up a logical equation in R.

## These two joint probabilities are equal!
#  p(Positive n Disease) = p(Disease n Positive)

(p_positive_given_disease * p_disease) == (p_disease_given_positive * p_positive)

So, if they are equal, what we are saying is this:

p(Disease | Positive) * p(Positive) = p(Positive | Disease) * p(Disease)

Now, with some algebra, we can divide the right side of the equation by p(Positive) and we are left with Bayes Theorem for our problem:

p(Disease | Positive) = p(Disease) * p(Positive | Disease) / p(Positive)

Putting it altogether, it looks like this:

So, all we’ve done is taken two joint probabilities and used some algebra to arrange the terms in order to get us to the conditional probability we were interested in, p(Disease | Positive) and we end up with Bayes Theorem.

How Bayesian Search Theory Can Help You Find More Deer

Introduction

I was talking with a friend the other day who was telling me about his brother, who leads guided deer hunts in Wyoming. Typically, clients will come out for a hunt over several days and rely on him to guide them to areas of the forest where there is a high probability of seeing deer. Of course, nothing is guaranteed! It’s entirely possible to go the length of the trip and not see any deer at all. So, my friend was explaining that his brother is very good at constantly keeping an eye on the environment and his surroundings and creating a mental map in his head about the areas that will maximize his clients chances of finding deer. (There is probably an actual name for this skill, but I’m not sure what it is).

This is an interesting problem and reminds me of Bayesian Search Theory, which is used to help locate objects based on prior knowledge/information and the probability of seeing the object within a specific area given it would actually be there. This approach was most recently popularized for its use in the search for the wreckage of Malaysian Airlines Flight 370.

Let’s walk through an example of how Bayesian Search Theory works.

Setting up the search grid

Let’s say our deer guide has a map that he has broken up into a 4×4 grid of squares. He places prior probabilities of seeing a deer in each region given what he knows about the terrain (e.g., areas with water and deer food will have a higher probability of deer activity).

His priors grid looks like this:

library(tidyverse)

theme_set(theme_light())

# priors for each square region looks like this
matrix(data = c(0.01, 0.02, 0.01, 0.1, 0.1, 0.03, 0.03, 0.03, 
                0.2, 0.2, 0.17, 0.1, 0.01, 0.01, 0.02, 0.01), 
       byrow = TRUE, 
       nrow = 4, ncol = 4) %>%
  as.data.frame() %>%
  setNames(c("1", "2", "3", "4")) %>%
  pivot_longer(cols = everything(),
               names_to = 'x_coord') %>%
  mutate(y_coord = rep(1:4, each = 4)) %>%
  relocate(y_coord, .before = x_coord) %>%
  ggplot(aes(x = x_coord, y = y_coord)) +
  geom_text(aes(label = value, color = value),
            size = 10) +
  scale_color_gradient(low = "red", high = "green") +
  labs(x = "X Coorindates",
         y = "Y Coordinates",
         title = "Prior Probabilities of 4x4 Square Region",
         color = "Probability") +
  theme(axis.text = element_text(size = 11, face = "bold"))

We see that the y-coordiate range of 3 has a high probability of deer activity. In particular, xy = (1, 3) and xy = (2, 3) seem to maximize the chances of seeing a deer.

The likelihood grid

The likelihood in this case describe the probability of seeing a deer in a specific square region given that a deer is actually there. p(Square Region | Deer)

To determine these likelihoods, our deer guide is constantly scouting the areas and making mental notes about what he sees. He documents certain things within each square region that would indicate deer are there. For example, deer droppings, foot prints, actually seeing some deer, and previous successful hunts in a certain region. Using this information he creates a grid of the following likelihoods:

matrix(data = c(0.88, 0.82, 0.88, 0.85, 0.77, 0.65, 0.83, 0.95, 
                0.98, 0.97, 0.93, 0.94, 0.93, 0.79, 0.68, 0.80), 
       byrow = TRUE, 
       nrow = 4, ncol = 4) %>%
  as.data.frame() %>%
  setNames(c("1", "2", "3", "4")) %>%
  pivot_longer(cols = everything(),
               names_to = 'x_coord') %>%
  mutate(y_coord = rep(1:4, each = 4)) %>%
  relocate(y_coord, .before = x_coord) %>%
  ggplot(aes(x = x_coord, y = y_coord)) +
  geom_text(aes(label = value, color = value),
            size = 10) +
  scale_color_gradient(low = "red", high = "green") +
  labs(x = "X Coorindates",
         y = "Y Coordinates",
         title = "Likelihoods for each 4x4 Square Region",
         subtitle = "p(Region | Seeing Deer)",
         color = "Probability") +
  theme(axis.text = element_text(size = 11, face = "bold"))

Combining our prior knowledge and likelihoods

To make things easier, I’ll put both the priors and likelihoods into a single data frame.

dat <- data.frame(
  coords = c("1,1", "2,1", "3,1", "4,1", "1,2", "2,2", "3,2", "4,2", "1,3", "2,3", "3,3", "4,3", "1,4", "2,4", "3,4", "4,4"),
  priors = c(0.01, 0.02, 0.01, 0.1, 0.1, 0.03, 0.03, 0.03, 
                0.2, 0.2, 0.17, 0.1, 0.01, 0.01, 0.02, 0.01),
  likelihoods = c(0.88, 0.82, 0.88, 0.85, 0.77, 0.65, 0.83, 0.95, 
                0.98, 0.97, 0.93, 0.94, 0.93, 0.79, 0.68, 0.80))

dat

Now he multiplies the prior and likelihood together to summarize his belief of deer in each square region.

dat <- dat %>%
  mutate(posterior = round(priors * likelihoods, 2))

dat %>%
  ggplot(aes(x = coords, y = posterior)) +
  geom_col(color = "black",
           fill = "light grey") +
  scale_y_continuous(labels = scales::percent_format()) +
  theme(axis.text = element_text(size = 11, face = "bold"))

As expected, squares (1,3), (2,3), and (3,3) have the highest probability of observing a deer. Those would be the first areas that our deer hunt guide would want to explore when taking new clients out.

Updating Beliefs After Searching a Region

Since square (1,3) has the highest probability our deer hunt guide decides to take his new clients out there to search for deer. After one day of searching they don’t find any deer. To ensure success tomorrow, he needs to update his knowledge not only about square (1, 3) but about all of the other squares in his 4×4 map.

To update square (1, 3) we use the following equation:

update.posterior = prior * (1 – likelihood) / (1 – prior*likelihood)

coord1_3 <- dat %>%
  filter(coords == "1,3")

coord1_3$priors * (1 - coord1_3$likelihoods) / (1 - coord1_3$priors * coord1_3$likelihoods)

Thew new probability for region (1, 3) is 0.5%. Once we update that square region we can update the other regions using the following equation:

update.prior = prior * (1 / (1 – prior * likelihood))

We can do this for the entire data set all at once:

dat <- dat %>%
  mutate(posterior2 = round(priors * (1 / (1 - priors*likelihoods)), 2),
         posterior2 = ifelse(coords == "1,3", 0.005, posterior2)) %>%
  mutate(updated_posterior = round(posterior2 * likelihoods, 3))

dat %>%
  select(coords, posterior, updated_posterior) %>%
  pivot_longer(cols = -coords) %>%
  ggplot(aes(x = coords, y = value, fill = name)) +
  geom_col(position = "dodge") +
  scale_y_continuous(labels = scales::percent_format()) +
  theme(axis.text = element_text(size = 11, face = "bold"))


matrix(dat$updated_posterior, ncol = 4, nrow = 4, byrow = TRUE) %>%
  as.data.frame() %>%
  setNames(c("1", "2", "3", "4")) %>%
  pivot_longer(cols = everything(),
               names_to = 'x_coord') %>%
  mutate(y_coord = rep(1:4, each = 4)) %>%
  relocate(y_coord, .before = x_coord) %>%
  ggplot(aes(x = x_coord, y = y_coord)) +
  geom_text(aes(label = value, color = value),
            size = 10) +
  scale_color_gradient(low = "red", high = "green") +
  labs(x = "X Coorindates",
         y = "Y Coordinates",
         title = "Updated Posterior for each 4x4 Square Region after searching (1,3) and\nnot seeing deer",
         color = "Probability") +
  theme(axis.text = element_text(size = 11, face = "bold"))

We can see that after updating the posteriors following day 1, hist best approach is to search grid (2, 3) and (3,3) tomorrow, as the updated beliefs indicate that they have a higher probability of having a deer in them.

Conclusion

We can of course continue updating after searching each region until we finally find the deer but we will stop here and allow you to play with the code and continue on if you’d like. This tutorial is just to provide a brief look into how to use Bayesian Search Theory to locate objects in various spaces, so hopefully you can use this method and apply it to other aspects of your life.

The complete code is available on my GitHub page.

Bayesian Updating for Normally Distributed Data – A few different approaches for the normal-normal conjugate

Introduction

Bayesian updating provides a way of combining prior knowledge/belief with newly observed data to obtain an updated knowledge of the world (posterior). Most Bayesian updating examples begin by observing a binomial outcome and combining those observations with a beta prior. While this is useful for understanding the basic crux of Bayesian updating, not all problems that we face in the real world will be binomial in nature, thus requiring a different likelihood distribution. For example, normally distributed data can be challenging to work with because there are two parameters (a mean and standard deviation) that have their own respective variances. Two circumvent this issue, in a normal-normal conjugate, we often accept one of the parameters as being known and fixed in the population (essentially treating it as a nuisance parameter and not something we are explicitly modeling). Often, because we care about updating our knowledge about the mean (center) of an observed value the standard deviation is taken to be fixed for the population, allowing us to create an updated mean and a corresponding distribution around it.

In reading about various approaches to normal-normal conjugate, I’ve noted three methods that can be used for Bayesian updating of a normally distributed variable in a simple way. The difference between the three approaches appears to be with the amount of information we have available to us about the observed values. These approaches are easy to use and can be applied quickly by a practitioner, with just a calculator, offering a convenient way to make observations and rationalize about the world around us.

The information required for the three approaches is as follows (I’ll share references to where I got each approach in the sections below):

  1. We have a prior value for the population mean and the sample size that this mean was taken from. What we are lacking is information about the population standard deviation. Thus, we have no information about how the variable varies.
  2. We have a prior mean and standard deviation for the population but we are lacking sample size information that the mean and standard deviation was derived from. Thus, we know how the variable varies but we don’t know how confident we should be about the observations (a large sample means we’d be more confident while a smaller sample means we’d be less confident).
  3. We have all three pieces of population prior — mean, sd, and sample size.

The complete code and data are available on my GITHUB page.

Load Data

Reference: Data comes from basketball-reference.com advanced shooting stats.

We will load several seasons worth of NBA advanced shooting statistics and the stat we are interested in is Player Efficiency Rating (PER).


library(tidyverse)

theme_set(theme_light())

## load nba_advanced_shooting_stats.csv
d <- read.csv("nba_advanced_shooting_stats.csv", header = TRUE) %>%
  select(Season, Player, Pos, Age, Tm, G, MP, PER) %>%
  janitor::clean_names()

d %>%
  head() %>%
  knitr::kable()

We have 4 seasons worth of data (really about 3.5 given that the 2022-2023 season wasn’t complete when I scraped the original data).

Exploring Player Efficiency Rating & Minutes Played

Let’s focus on the Player Efficiency Rating (PER) and Minutes Played.

It looks like on average players has a PER greater than 0, between 10 and 15. The minutes played is right skewed with a vast majority of the players playing a low number of minutes and a few players playing a lot of minutes.

We can look at the numbers explicitly by evaluating the quantiles.

summary(d[, c("mp", "per")])

Setting up our priors

Since the 2022 – 2023 season was not finished when I scraped this data, we will base our prior for PER on the previous 3 seasons. Additionally, we will set up our prior mean from players in the population who had over the median number of minutes played in those seasons.

d %>%
  filter(season != "2022-2023",
         mp > median(mp)) %>%
  summarize(n_players = n(),
            avg_mp = mean(mp),
            avg_per = mean(per),
            sd_per = sd(per))

We can store these variables in their own elements so that they can be called later in our calculations.

prior_mu <- 14.79
prior_n <- 1448
prior_df <- prior_n - 1

Recall that for our prior standard deviation we need to obtain a prior for the standard deviation around the mean (a standard error of the mean) and we also need to obtain a known population standard deviation (what I referred to as the nuisance parameter above, since we wont be directly estimating it).

We will call the standard deviation for the mean PER, prior_sd, and the fixed standard deviation, prior_tau. To calculate the prior_sd we’ll take the standard deviation across the three seasons for each player and then take the mean of those player standard deviations. For prior_tau we’ll use the overall standard deviation of observed PER values for the three seasons (which was calculated in our summary function above). Again, we’ll store these values in their own elements for calculations later.

d %>%
  filter(season != "2022-2023",
         mp &gt; median(mp)) %>%
  group_by(player) %>%
	summarize(per_sd = sd(per),
	          .groups = "drop") %>%
  summarize(mean(per_sd, na.rm = TRUE))


prior_sd <- 1.57
prior_var <- prior_sd^2
prior_precision <- 1 / prior_var

prior_tau <- 4.53
prior_tau_var <- prior_tau^2
prior_tau_precision <- 1 / prior_tau_var


Selecting one player

Let’s start with one player and work through the three approaches explained above before applying them to the full data set.

We will select a player with a low number of minutes played so that we can see how their PER behaves when we combine it with our prior. I’ll select Thanasis Antetokounmpo from the 2022-2023 season.

ta <- d %>%
  filter(season == "2022-2023",
         player == "Thanasis Antetokounmpo")

ta

We don’t know Thanasis Antetokounmpo standard deviation of player efficiency rating over the 21 games (91 minutes) he played. Therefore, we don’t have a standard deviation for his production.

Let’s store his observed values in separate elements.

obs_mu <- 1.9
obs_n <- 91

Method 1

I stumbled upon this method in the 2nd edition of Wayne Winston’s fantastic book, Mathletics.

Combining the observed PER and sample size (minutes played) for Antetokounmpo with the prior PER and prior sample size for the population, we see that Antetokoumpo’s estimated PER gets pulled up closer to the population mean, though still below average.

To get a sense for how much sample size effects the shrinkage towards the prior, let’s pretend that Antetokounmpo had 1200 minutes of observation with the same PER.

Notice that with 1200 minutes played we are much more certain that Antetokounmpo has a below average PER.

Method 2

Recall that for method 2 to work we require a mean and standard deviation for Antetokounmpo’s PER. Since we don’t have a standard deviation for his PER in the 2022-2023 we will get his PER from the previous 3 seasons and calculate a standard deviation. We will store that value in its own element.

This approach was discussed in Chapter 9 of Gelman and Hill’s Regression and Other Stories.

d %>%
  filter(season != "2022-2023",
         player == "Thanasis Antetokounmpo") %>%
  summarize(sd(per))

obs_sd <- 1.19

Applying method 2 we get the following result.

## Posterior
bayes_v2 <- ((1/prior_sd^2 * prior_mu) + (1 / obs_sd^2 * obs_mu))/((1/obs_sd^2) + (1/prior_sd^2))

bayes_v2

## Posterior SD
bayes_v2_sd <- sqrt(1/(1/obs_sd^2 + 1/prior_sd^2))
bayes_v2_sd

## Posterior 95% CI
bayes_v2 + qnorm(p = c(0.025, 0.975))*bayes_v2_sd

We could use a similar approach with just the mean and standard deviation (no sample size info) but use precision (1 / variance) as the parameter describing our spread in the data (instead of SD). We obtain the same results.

obs_precision <- 1 / obs_sd^2

posterior_precision <- prior_precision + obs_precision

bayes_v2.2 <- prior_precision/posterior_precision * prior_mu + obs_precision/posterior_precision * obs_mu

bayes_v2.2

bayes_v2.2_sd <- sqrt(1/posterior_precision)
bayes_v2.2_sd

## Posterior 95% CI
bayes_v2.2 + qnorm(p = c(0.025, 0.975))*bayes_v2.2_sd

This result is much more conservative than method 1. We see that Antetokounmpo is estimated to be well below average. Additionally, now that we have a standard deviation for Antetokounmpo’s PER we are also able to calculate a credible interval for his performance.

Method 3

For this final method we will use all of the observed info – mean, sd, and minutes play. This approach was presented in William Bolstad’s Introduction to Bayesian Statistics, 2nd Ed.

bayes_v3_precision <- prior_precision + obs_n/prior_tau_var
bayes_v3_precision

bayes_v3_sd <- sqrt(1/bayes_v3_precision)
bayes_v3_sd

bayes_v3 <- (prior_precision / (obs_n/prior_tau_var + prior_precision))*prior_mu + ((obs_n/prior_tau_var) / (obs_n/prior_tau_var + prior_var)) * obs_mu

bayes_v3

## Posterior 95% CI
bayes_v3 + qnorm(p = c(0.025, 0.975))*bayes_v3_sd

Comparing the Results

data.frame(bayes_v1, bayes_v2, bayes_v2_sd, bayes_v3, bayes_v3_sd) %>%
  knitr::kable()

  • Method 1 has the largest pull towards the prior mean because it uses the least information. Since we don’t have an observed standard deviation for our observation, we also don’t have any information about the variability in the posterior mean.
  • Method 2 has less pull to the prior mean than version 1 and also has a rather large standard deviation around the values.
  • Methods 3 has the lowest pull towards the mean compared to the other three approaches and it uses the largest amount of information.

Antetokounmpo only had 91 minutes of observation time. To show how sample sizes effects our estimate, if we increase his sample size to 1000 we end up with more confidence about his performance (an estimated PER closer to the observed 1.9 and a smaller standard deviation).


bayes_v3.3_precision <- prior_precision + 1000/prior_tau_var
bayes_v3.3_precision

bayes_v3.3_sd <- sqrt(1/bayes_v3.3_precision)
bayes_v3.3_sd

bayes_v3.3 <- (prior_precision / (1000/prior_tau_var + prior_precision))*prior_mu + ((1000/prior_tau_var) / (1000/prior_tau_var + prior_var)) * obs_mu

bayes_v3.3

## Posterior 95% CI
bayes_v3.3 + qnorm(p = c(0.025, 0.975))*bayes_v3.3_sd


Let’s create a simulation using rnorm() and plot the estimates from the three methods. Since we don’t have a standard deviation for method 1 we will use the prior_sd. We notice that method 3, which uses the most information gives us a much more conservative belief about the player’s true performance compared to the other two methods.

N <- 1e4

set.seed(9087)
v1_sim <- rnorm(n = N, mean = bayes_v1, sd = prior_sd)
v2_sim <- rnorm(n = N, mean = bayes_v2, sd = bayes_v2_sd)
v3_sim <- rnorm(n = N, mean = bayes_v3, sd = bayes_v3_sd)


plot(density(v1_sim), 
     col = "blue",
     lwd = 3,
     xlim = c(0, 20),
     ylim = c(0, 0.95),
     main = "Bayesian Normal Updating -- 3 Approaches\nDashed Line = Observed PER")
lines(density(v2_sim), 
     col = "red",
     lwd = 3)
lines(density(v3_sim), 
     col = "green",
     lwd = 3)
abline(v = obs_mu,
       col = "black",
       lty = 2,
       lwd = 2)
legend(x = 12,
       y = 0.8,
       c("Method 1", "Method 2", "Method 3"),
       col = c("blue", "red", "green"),
       lwd = 2)

Wrapping Up

The normal-normal conjugate can be a little tricky compared to a beta-binomial conjugate, but it is an important distribution to work with given most of the data we deal with on a regular basis. Without getting into complex modeling we can use a few simple approaches for a normal-normal conjugate that allows us to quickly update our beliefs based on various bits of information we have access to. Hopefully this article was useful at showing a few of these approaches (there are others!).

The full code for this article is available on my GITHUB page.

If you notice any errors or have additional thoughts, feel free to email me!

Bayesian Priors for Categorical Variables using rstanarm

Continuing with more Bayesian data analysis using the {rstanarm} package, today walk through the ways of setting priors on categorical variables.

NOTE: Priors are a pretty controversial piece in Bayesian statistics and one of the arguments people make against Bayesian data analysis. Thus, I’ll also show what happens when you are overly bullish with your priors/

The full code is accessible on my GITHUB page.

Load Packages & Data

We are going to use the mtcars data set from R. The cylinder variable (cyl) is read in as a numeric but it only have three levels (4, 6, 8), therefore, we will convert it to a categorical variable and treat it as such for the analysis.

We are going to build a model that estimates miles per gallon (mpg) from the number of cylinders a  car has. So, we will start by looking at the mean and standard deviation of mpg for each level of cyl.

## Bayesian priors for categorical variables using rstanarm

library(rstanarm)
library(tidyverse)
library(patchwork)

### Data -----------------------------------------------------------------
d <- mtcars %>%
  select(mpg, cyl, disp) %>%
  mutate(cyl = as.factor(cyl),
         cyl6 = ifelse(cyl == "6", 1, 0),
         cyl8 = ifelse(cyl == "8", 1, 0))

d %>% 
  head()

d %>%
  group_by(cyl) %>%
  summarize(avg = mean(mpg),
            SD = sd(mpg))

Fit the model using Ordinary Least Squares regression

Before constructing our Bayesian model, we fit the model as a basic regression model to see what the output looks like.

## Linear regression ------------------------------------------------------
fit_lm <- lm(mpg ~ cyl, data = d)
summary(fit_lm)

  • The model suggests there is a relationship between mpg and cyl number
  • A 4 cyl car is represented as the intercept. Consequently, the intercept represents the average mpg we would expect from a 4 cylinder car.
  • The other two coefficients (cyl6 and cyl8) represent the difference in mpg for each of those cylinder cars relative to a 4 cylinder car (the model intercept). So, a 6 cylinder can, on average, will get 7 less mpg than a 4 cylinder car while an 8 cylinder car will, on average, get about 12 less mpg’s than a 4 cylinder car.

Bayesian regression with rstanarm — No priors specified

First, let’s fit the model with no priors specified (using the functions default priors) to see what sort of output we get.

## setting no prior info
stan_glm(mpg ~ cyl, data = d) %>%
  summary(digits = 3)

  • The output is a little different than the OLS model. First we see that there are no p-values (in the spirit of Bayes analysis!).
  • We do find that the model coefficients are basically the same as those produce with the OLS model and even the standard deviation is similar to the standard errors from above.
  • Instead of p-values for each coefficient we get 80% credible intervals.
  • The sigma value at the bottom corresponds to the residual standard error we got in our OLS model.

Basically, the default priors “let the data speak” and reported back the underlying relationship in the empirical data.

Setting Some Priors

Next, we can set some minimally informative priors. These priors wont contain much information and, therefore, will be highly influenced by minimal amounts of evidence regarding the underlying relationship that is present in the data.

To set priors on independent variables in rstanarm we need to create an element to store them. We have two independent variables (cyl6 and cyl8), both requiring priors (we will set the prior for the intercept and the model sigma in the function directly). To set these priors we need to determine a distribution, a mean value (location), and a standard deviation (scale). We add these values into the distribution function in the order in which they will appear in the model. So, there will be a vector of location that is specific to cyl6 and cyl8 and then a vector of scale that is also specific to cyl6 and cyl8, in that order.

## Setting priors
ind_var_priors <- normal(location = c(0, 0), scale = c(10, 10))

Next, we run the model.

fit_rstan <- stan_glm(mpg ~ cyl, 
                      prior = ind_var_priors,
                      prior_intercept = normal(15, 8),
                      prior_aux = cauchy(0, 3),
                      data = d)

# fit_rstan
summary(fit_rstan, digits = 3)

Again, this model is not so different from the one that used the default priors (or from the findings of the OLS model). But, our priors were uninformative.

One note I’ll make, before proceeding on, is that you can do this a different way and simply dummy code the categorical variables and enter those dummies directly into the model, setting priors on each, and you will obtain the same result. The below code dummy codes cyl6 and cyl8 as booleans (1 = yes, 0 = no) so when both are 0 we effectively are left with cyl4 (the model intercept).

############################################################################################
#### Alternate approach to coding the priors -- dummy coding the categorical variables #####
############################################################################################

d2 <- d %>%
  mutate(cyl6 = ifelse(cyl == "6", 1, 0),
         cyl8 = ifelse(cyl == "8", 1, 0))

summary(lm(mpg ~ cyl6 + cyl8, data = d2))

stan_glm(mpg ~ cyl, 
         prior = ind_var_priors,
         prior_intercept = normal(15, 8),
         prior_aux = cauchy(0, 3),
         data = d2) %>%
  summary()

###########################################################################################
###########################################################################################

Okay, back to our regularly scheduled programming…..

So what’s the big deal?? The model coefficients are relatively the same as with OLS. Why go through the trouble? Two reasons:

  1. Producing the posterior distribution of model coefficients posterior predictive distribution for the dependent variable allows us to evaluate our uncertainty around each. I’ve talked a bit about this before (Making Predictions with a Bayesian Regression Model, Confidence & Prediction Intervals – Compare and Contrast Frequentist and Bayesian Approaches, and Approximating a Bayesian Posterior with OLS).
  2. If we have more information on relationship between mpg and cylinders we can code that in as information the model can use!

Let’s table point 2 for a second and extract out some posterior samples from our Bayesian regression and visualize the uncertainty in the coefficients.

# posterior samples
post_rstan <- as.matrix(fit_rstan) %>%
  as.data.frame() %>%
  rename('cyl4' = '(Intercept)')

post_rstan %>%
  head()

mu.cyl4 <- post_rstan$cyl4
mu.cyl6 <- post_rstan$cyl4 + post_rstan$cyl6
mu.cyl8 <- post_rstan$cyl4 + post_rstan$cyl8

rstan_results <- data.frame(mu.cyl4, mu.cyl6, mu.cyl8) %>%
  pivot_longer(cols = everything())


rstan_plt <- rstan_results %>%
  left_join(
    
    d %>%
      group_by(cyl) %>%
      summarize(avg = mean(mpg)) %>%
      rename(name = cyl) %>%
      mutate(name = case_when(name == "4" ~ "mu.cyl4",
                              name == "6" ~ "mu.cyl6",
                              name == "8" ~ "mu.cyl8"))
    
  ) %>%
  ggplot(aes(x = value, fill = name)) +
  geom_histogram(alpha = 0.4) +
  geom_vline(aes(xintercept = avg),
             color = "black",
             size = 1.2,
             linetype = "dashed") +
  facet_wrap(~name, scales = "free_x") +
  theme_light() +
  theme(strip.background = element_rect(fill = "black"),
        strip.text = element_text(color = "white", face = "bold")) +
  ggtitle("rstanarm")

rstan_plt

  • The above plot represents the posterior distribution (the prior combined with the observed data, the likelihood) of the estimated values for each of our cylinder types.
  • The dashed line is the observed mean mpg for each cylinder type in the data.
  • The distribution helps give us a good sense of the certainty (or uncertainty) we have in our estimates.

We can summarize this uncertainty with point estimates (e.g., mean and median) and measures of spread (e.g., standard deviation, credible intervals, quantile intervals).


# summarize posteriors
mean(mu.cyl4)
sd(mu.cyl4)
qnorm(p = c(0.05, 0.95), mean = mean(mu.cyl4), sd = sd(mu.cyl4))
quantile(mu.cyl4, probs = c(0.05, 0.25, 0.5, 0.75, 0.95))

mean(mu.cyl6)
sd(mu.cyl6)
qnorm(p = c(0.05, 0.95), mean = mean(mu.cyl6), sd = sd(mu.cyl6))
quantile(mu.cyl6, probs = c(0.05, 0.25, 0.5, 0.75, 0.95))

mean(mu.cyl8)
sd(mu.cyl8)
qnorm(p = c(0.05, 0.95), mean = mean(mu.cyl8), sd = sd(mu.cyl8))
quantile(mu.cyl8, probs = c(0.05, 0.25, 0.5, 0.75, 0.95))

For example, the below information tells us that cyl8 cars will, on average, provide us with ~15.2 mpg with a credible interval between 13.7 and 16.2. The median value is 15.2 with an interquartile range between 14.6 and 15.8 and a 90% quantile interval ranging between 13.7 and 16.6.

Bullish Priors

As stated earlier, priors are one of the most controversial aspects of Bayesian analysis. Most argue against Bayes because they feel that priors can be be manipulated to fit the data. However, what many fail to recognize is that no analysis is void of human decision-making. All analysis is done by humans and thus there are a number of subjective decisions that need to be made along the way, such as deciding on what to do with outliers, how to handle missing data, the alpha level or level of confidence that you want to test your data against, etc. As I’ve said before, science isn’t often as objective as we’d like it to be. That all said, selecting priors can be done in a variety of ways (aside from just using non-informative priors as we did above). You could get expert opinion, you could use data and observations gained from a pilot study, or you can use information about parameters from previously conducted studies (though be cautious as these also might be bias due to publication issues such as the file drawer phenomenon, p-hacking, and researcher degrees of freedom).

When in doubt, it is probably best to be conservative with your priors. But, let’s say we sit down with a mechanic and inform him of a study where we are attempting to estimate the miles per gallon for 4, 6, and 8 cylinder cars. We ask him if he can help us with any prior knowledge about the decline in mpg when the number of cylinders increase. The mechanic is very bullish with his prior information and states,

“Of course I know the relationship between cylinders and miles per gallon!! Those 4 cylinder cars tend to be very economical and get around 50 mpg plus or minus 2. I haven’t seen too many 6 cylinder cars, but my hunch is that there are pretty similar to the 4 cylinder cars. Now 8 cylinder cars…I do a ton of work on those! Those cars get a bad wrap. In my experience they actually get better gas mileage than the 4 or 6 cylinder cars. My guess would be that they can get nearly 20 miles per gallon more than a 4 cylinder car!”

Clearly our mechanic has been sniffing too many fumes in the garage! But, let’s roll with his beliefs and codify them as prior knowledge for our model and see how such bullish priors influence the model’s behavior.

  • We set the intercept to be normally distributed with a mean of 50 and a standard deviation of 2.
  • Because the mechanic felt like the 6 cylinder car was similar to the 4 cylinder car we will stick suggest that the difference between 6 cylinders and 4 cylinders is normally distributed with a mean of 0 and standard deviation of 2.
  • Finally, we use the crazy mechanics belief that the 8 cylinder car gets roughly 20 more miles per gallon than the 4 cylinder car and we code its prior to be normally distributed with a mean of 20 and standard deviation of 5.

Fit the model…


## Use wildly different priors ---------------------------------------------------------
ind_var_priors2 <- normal(location = c(0, 20), scale = c(10, 5))

fit_rstan2 <- stan_glm(mpg ~ cyl, 
                       prior = ind_var_priors2,
                       prior_intercept = normal(50, 2),
                       prior_aux = cauchy(0, 10),
                       data = d)

summary(fit_rstan2, digits = 3)


Wow! Look how much the overly bullish/informative priors changed the model output.

  • Our new belief is that a 4 cylinder car gets approximately 39 mpg and the 6 cylinder car gets about 3 more mpg than that, on average.
  • The 8 cylinder car is now getting roughly 14 mpg more than the 4 cylinder car.

The bullish priors have overwhelmed the observed data. Notice that the results are not exact to the prior but the prior, as they are tugged a little bit closer to the observed data, though not by much. For example, we specified the 8 cylinder car to have about 20 mpg over a 4 cylinder car. The observed data doesn’t indicate this to be true (8 cylinder cars were on average 11 mpg LESS THAN a 4 cylinder car) so the coefficient is getting pulled down slightly, from our prior of 20 to 14.4.

Let’s plot the posterior distribution.

# posterior samples
post_rstan <- as.matrix(fit_rstan2) %>%
  as.data.frame() %>%
  rename('cyl4' = '(Intercept)')

post_rstan %>%
  head()

mu.cyl4 <- post_rstan$cyl4
mu.cyl6 <- post_rstan$cyl4 + post_rstan$cyl6
mu.cyl8 <- post_rstan$cyl4 + post_rstan$cyl8

rstan_results <- data.frame(mu.cyl4, mu.cyl6, mu.cyl8) %>%
  pivot_longer(cols = everything())


rstan_plt2 <- rstan_results %>%
  left_join(
    
    d %>%
      group_by(cyl) %>%
      summarize(avg = mean(mpg)) %>%
      rename(name = cyl) %>%
      mutate(name = case_when(name == "4" ~ "mu.cyl4",
                              name == "6" ~ "mu.cyl6",
                              name == "8" ~ "mu.cyl8"))
    
  ) %>%
  ggplot(aes(x = value, fill = name)) +
  geom_histogram(alpha = 0.4) +
  geom_vline(aes(xintercept = avg),
             color = "black",
             size = 1.2,
             linetype = "dashed") +
  facet_wrap(~name, scales = "free_x") +
  theme_light() +
  theme(strip.background = element_rect(fill = "black"),
        strip.text = element_text(color = "white", face = "bold")) +
  ggtitle("rstanarm 2")

rstan_plt2

Notice how different these posteriors are than the first Bayesian model. In every case, the predicted mpg from the number of cylinders are all over estimating the observed mpg by cylinder (dashed line).

Wrapping Up

Today we went through how to set priors on categorical variables using rstanarm. Additionally, we talked about some of the skepticism about priors and showed what can happen when the priors you select are too overconfident. The morale of the story is two-fold:

  1. All statistics (Bayes, Frequentist, Machine Learning, etc) have some component of subjectivity as the human doing the analysis has to make decisions about what to do with their data at various points.
  2. Don’t be overconfident with your priors. Minimally informative priors maybe be useful to allowing us to assert some level of knowledge of the outcome while letting that knowledge be influenced/updated by what we’ve just observed.

The full code is accessible on my GITHUB page.

If you notice any errors, please reach out!