
Feedback from the last two blog entries suggests that people seem to enjoy the “how to” nature of them. Walking through how to do some basic coding steps while exploring, summarizing, visualizing, and analyzing data is a great way to help others feel comfortable when trying to move from excel or SPSS to a code language (like R or Python). Additionally, this also helping me to get back to first principles and put together a step-by-step approach to teaching this stuff to others.
As such, I’ve decided to start incorporating some articles where I walk through each line of code. Since I’ve started to do a bit more work in Python (though I still strongly favor R), I feel like this is a great place for me to start.
For those of us who started out in sport and exercise science, using Excel Pivot Tables was one of the first way we began to explore our data and summarize what was there. Today, I’ll walk through how we can create some of those exact same pivot tables in Python.
The Jupyter Notebook and data for this article are available on my GitHub page.
The data I used for this article was taken from www.hockey-reference.com and consists of game outcomes from the 2014-2015 Season through the 2018-2019 Season. I stored the data as a .csv file for this article but I’ll do a future blog article on how to scrape data from webpages like this. This is additionally fun because I know very little about hockey, so I get to learn along the way!
Step 1: Load Packages
- First I start out just loading the packages (Python people call them “libraries” but I’m still stuck in the old R jargon, so I say “packages”) that contain some of the functions that I’ll need to do my analysis.
- Pandas is the main data frame package in Python and numpy is useful for dealing with arrays and various mathematical functions.
- Seaborn and Matplotlib are two packages that I mainly use for data visualizing, however I do not do anything visualization in this article.
- Finally, the OS package is what I use to check my working directory and change the working directory, if needed (more on that later).
- Once importing each package I give them an alias (e.g., pandas as pd) so that I can use a short hand version of the package name when I call one of it’s functions, which you will see throughout this article.
# Load packages

import pandas as pd
import numpy as np
import seaborn as sns
import matplotlib.pyplot as plt
import os as os
Step 2: Change the working directory if needed and load data
- The working directory is the place where the data for your analysis is stored.
- os.getcwd() is a function from the “os” package that gets my current working directory. If the directory needs to be changed to a different folder (for example, if the data were stored somewhere other than my desktop), I use the os.chdir() function to change it.
- Once I have the directory set, I load the data using the pd.read_csv() function from the pandas package.
- After the data is loaded, we take a look at the first few rows of the data frame.
- An example of all of these steps is provided in the screen shot of my Jupyter notebook.
# Get current working directory
os.getcwd()

# Change the working directory
os.chdir('/Users/Patrick/Desktop')

# Load the 2014 - 2018 NHL Scores data
nhl = pd.read_csv('2014-2018 NHL Scores.csv')

# Look at the first few rows
nhl.head()

Step 3: Clean up the data (All little housekeeping)
- We notice that the Goals (‘G’) column is repeated, once for the Visitor and once for the Home team. Thus, the second time it is referred to as ‘G.1’. So, we can rename these columns to ‘Visitor_G’ and ‘Home_G’, so that they are more explicit and less confusing.
- Next, we want to create four new columns. First, we create a column that calculates the point differential of the game for the home team. Then we create a column that identifies whether the winner was the home or away team. Finally, we create a column that tells us which team was the winner and a column telling us which team was the loser. You can see that I do all of these steps by first creating the conditions I’m testing (comparing goals for the home team to goals for the away team) and then assigning the outcome a specific label (e.g. home, away, or tie).
nhl['Point_Diff'] = nhl['Home_G'] - nhl['Visitor_G']

conditions = [
(nhl['Home_G'] > nhl['Visitor_G']),
(nhl['Home_G'] < nhl['Visitor_G']),
(nhl['Home_G'] == nhl['Visitor_G'])]

choices = ['home', 'visitor', 'tie']

nhl['winner'] = np.select(conditions, choices, default = 'null')

cond_for_winner = [
(nhl['winner'] == 'home'),
(nhl['winner'] == 'visitor'),
(nhl['winner'] == 'tie')]

choices_for_winner = [nhl['Home'], nhl['Visitor'], 'tie']
choices_for_loser = [nhl['Visitor'], nhl['Home'], 'tie']

nhl['winning_team'] = np.select(cond_for_winner, choices_for_winner, default = 'null')
nhl['losing_team'] = np.select(cond_for_winner, choices_for_loser, default = 'null')
- Our data frame now looks like this:

Step 4: Create Pivot Tables
Now that we have the data arranged, we can create some pivot tables.
First, let’s create a pivot table looking at the average home point differential by season.
nhl.groupby('Season').mean()['Point_Diff']
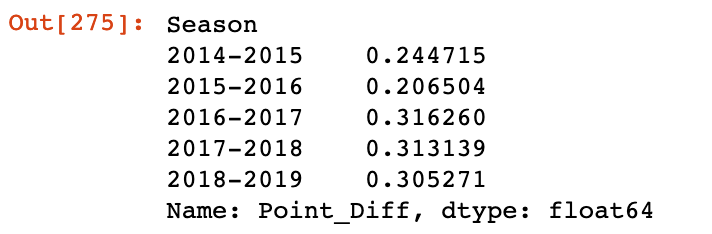
I produced this, as you can see from the code, by looking for the mean of ‘Point_Diff’, grouped by the variable ‘Season’.
This is useful, but I don’t love how it looks. Using the pivot_table() function, we can get a nicer looking output.
nhl.pivot_table(values = 'Point_Diff', index = 'Season', aggfunc = np.mean)

Much nicer!!
Next, lets look at how many times the home team won.
nhl.groupby(['winner']).size()

If we divide by the total number of observations, we get the percentage of times the home team won.
nhl.groupby(['winner']).size() / len(nhl.index)

We can also look at home and visitor win percentage by each season within our data, again by using the groupby() function. We then create two columns, one for home and one for visitor win percentage with just some basic math.
season_totals = nhl.groupby(['Season', 'winner']).size().unstack()
season_totals['Home_Win_Pct'] = season_totals['home'] / (season_totals['home'] + season_totals['visitor'])
season_totals['Visitor_Win_Pct'] = season_totals['visitor'] / (season_totals['home'] + season_totals['visitor'])
season_totals

Finally, we can look at the Win% for each team over this 5 year stretch. Three steps were required to do this:
- The first chunk of code gets the total number of times each team played a game.
- The second chunk of code tally’s up the teams total wins and losses and stores them in a data frame (team_perf).
- The final chunk of code calculates a win percentage an then sorts the win percentage from best to worse.
team_win_totals = nhl.groupby(['winning_team']).size()
team_loss_totals = nhl.groupby(['losing_team']).size()

team_win_totals = pd.DataFrame(team_win_totals, columns = ['wins'])
team_loss_totals = pd.DataFrame(team_loss_totals, columns = ['losses'])
team_perf = team_win_totals.join(team_loss_totals)

team_perf['Win_Pct'] = team_perf['wins'] / (team_perf['wins'] + team_perf['losses'])
team_perf.sort_values(by = ['Win_Pct'], ascending = False)

Conclusion
There are a number of other things we could have built Pivot Tables on to explore this simple data set. Feel free to take the code and the data from my GitHub page and play around with it yourself. I don’t code too often in Python (still trying to figure out a lot of the syntax) so if you notice any errors in the code or ways to make it cleaner (nothing beats R Tidyverse, in my opinion), feel free to comment below.