tidymodels: bootstrapping for coefficient uncertainty and prediction

Julia Silge recently posted a new #tidytuesday blog article using the {tidymodels} package to build bootstrapped samples of a data set and then fit a linear to those bootstrapped samples as a means of exploring the uncertainty around the model coefficients.

I’ve written a few pieces on resampling methods here (See TidyX Episode 98 and THIS article I wrote about how to approximate a Bayesian Posterior Prediction). I enjoyed Julia’s article (and corresponding screen cast) so I decided to expand on what she shared, this time using Baseball data, and show additional ways of evaluating the uncertainty in model coefficients as well as extending out the approach to using the bootstrapped models for prediction uncertainty.

Side Note: We interviewed Julia on TidyX Episode 86.

Load Packages & Data

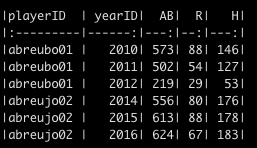
We will be using the {Lahman} package in R to obtain hitting statistics of all players with a minimum of 200 at bats, from the 2010 season or greater.

Our goal here is to work with a simple linear model that regresses the dependent variable, Runs, on the independent variable, Hits. (Note: Runs is really a count variable, so we could have modeled this differently, but we will stick with a simple linear model for purposes of simplicity and to show how bootstrapping can be used to understand uncertainty.)

## packages
library(tidyverse)
library(Lahman)
library(tidymodels)
library(broom)

theme_set(theme_light())

## data
d <- Batting %>%
  filter(yearID >= 2010) %>%
  select(playerID, yearID, AB, R, H) %>%
  group_by(playerID, yearID) %>%
  summarize(across(.cols = everything(),
                   ~sum(.x)),
            .groups = "drop") %>%
  filter(AB >= 200)

d %>%
  head() %>%
  knitr::kable()

Exploratory Data Analysis

Before we get into the model, we will just make a simple plot of the data and produce some basic summary statistics (all of the code for this will is available on my GITHUB page).


Linear Regression

First, we produce a simple linear regression using all the data to see what the coefficients look like. I’m doing this to have something to compare the bootstrapped regression coefficients to.

## Model
fit_lm <- lm(R ~ H, data = d)
tidy(fit_lm)

It looks like, for every 1 extra hit that a player gets it increases their Run total, on average, by approximately 0.518 runs. The intercept here is not interpretable since 0 hits wouldn’t lead to negative runs. We could mean scale the Hits variable to fix this problem but we will leave it as is for the this example since it isn’t the primary focus. For now, we can think of the intercept as a value that it just helping calibrate our Runs data to a fixed value on the y-axis.

{tidymodels} regression with bootstrapping

First, we create 1000 bootstrap resamples of the data.

### 1000 Bootstrap folds
set.seed(9183)
boot_samples <- bootstraps(d, times = 1000)
boot_samples


Next, we fit our linear model to each of the 1000 bootstrapped samples. We do this with the map() function, as we loop over each of the splits.

fit_boot <- boot_samples %>%
  mutate(
    model = map(
      splits,
      ~ lm(R ~ H,
           data = .x)
    ))

fit_boot


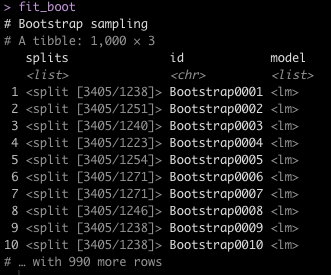
Notice that we have each of our bootstrap samples stored in a list (splits) with a corresponding bootstrap id. We’ve added a new column, which stores a list for each bootstrap id representing the linear model information for that bootstrap sample.

Again, with the power of the map() function, we will loop over the model lists and extract the model coefficients, their standard errors, t-statistics, and p-values for each of the bootstrapped samples. We do this using the tidy() function from the {broom} package.

boot_coefs <- fit_boot %>%
  mutate(coefs = map(model, tidy))

boot_coefs %>%
  unnest(coefs)


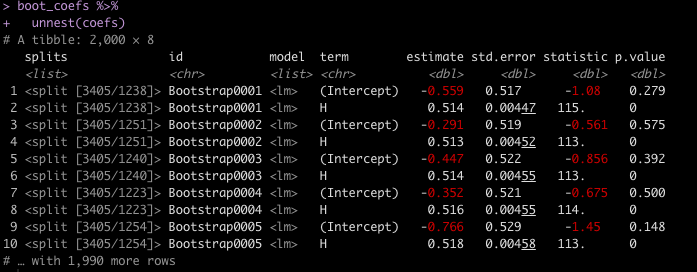
The estimate column is the coefficient value for each of the model terms (Intercept and H). Notice that the values bounce around a bit. This is because the bootstrapped resamples are each slightly different as we resample the data, with replacement. Thus, slightly different models are fit to each of those samples.

Uncertainty in the Coefficients

Now that we have all of 1000 different model coefficients, for each of the resampled data sets, we can begin to explore their uncertainty.

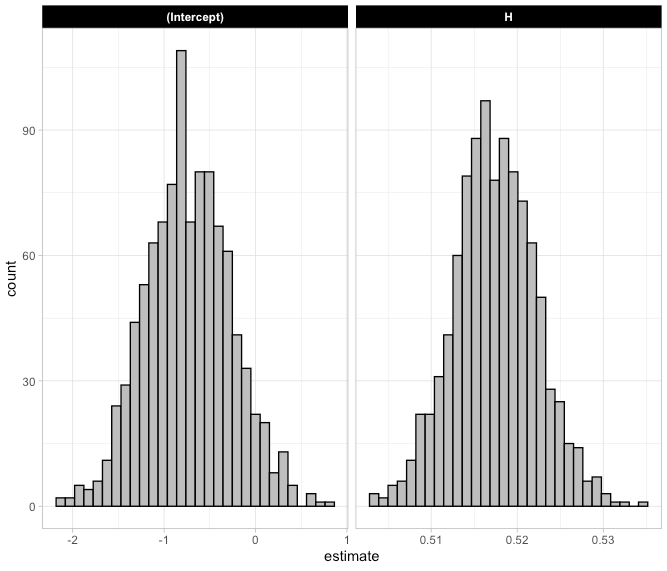
We start with a histogram of the 1000 model coefficients to show how large the uncertainty is around the slope and intercept.

boot_coefs %>%
  unnest(coefs) %>%
  select(term, estimate) %>%
  ggplot(aes(x = estimate)) +
  geom_histogram(color = "black",
                 fill = "grey") +
  facet_wrap(~term, scales = "free_x") +
  theme(strip.background = element_rect(fill = "black"),
        strip.text = element_text(color = "white", face = "bold"))

We can also calculate the mean and standard deviation of the 1000 model coefficients and compare them to what we obtained with the original linear model fit to all the data.

## bootstrapped coefficient's mean and SD
boot_coefs %>%
  unnest(coefs) %>%
  select(term, estimate) %>%
  group_by(term) %>%
  summarize(across(.cols = estimate,
                   list(mean = mean, sd = sd)))

# check results against linear model
tidy(fit_lm)

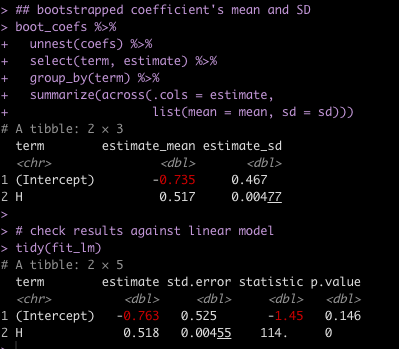
Notice that the values obtained by taking the mean and standard deviation of the 1000 bootstrap samples is very close the model coefficients from the linear model. They aren’t exact because the bootstraps are unique resamples. If you were to change the seed or not set the seed when producing bootstrap samples you would get different coefficients yet again. However, the bootstrap coefficients will always be relatively close approximations of the linear model regression coefficients within some margin of error.

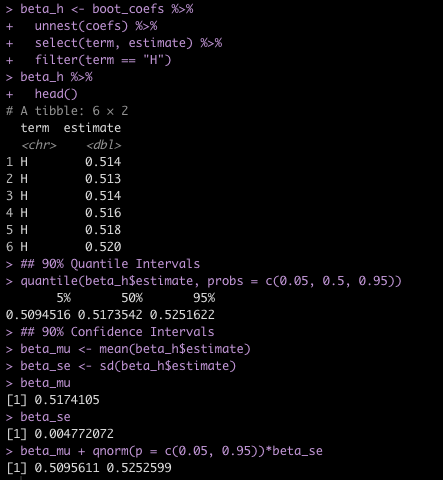
We can explore the coefficient for Hits, which was our independent variable of interest, by extracting its coefficients and calculating things like 90% Quantile Intervals and 90% Confidence Intervals.

beta_h <- boot_coefs %>%
  unnest(coefs) %>%
  select(term, estimate) %>%
  filter(term == "H")

beta_h %>%
  head()

## 90% Quantile Intervals
quantile(beta_h$estimate, probs = c(0.05, 0.5, 0.95))


## 90% Confidence Intervals
beta_mu <- mean(beta_h$estimate)
beta_se <- sd(beta_h$estimate)

beta_mu
beta_se

beta_mu + qnorm(p = c(0.05, 0.95))*beta_se

Of course, if we didn’t want to go through the trouble of coding all that, {tidymodels} provides us with a helper function called int_pctl() which will produce 95% Confidence Intervals by default and we can set the alpha argument to 0.1 to obtain 90% confidence intervals.

## can use the built in function from {tidymodels}
# defaults to a 95% Confidence Interval
int_pctl(boot_coefs, coefs)

# get 90% Confidence Interval
int_pctl(boot_coefs, coefs, alpha = 0.1)

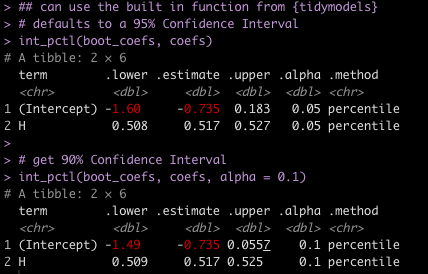
Notice that the 90% Confidence Interval for the Hits coefficient is the same as I calculated above.

Using the Bootstrapped Samples for Prediction

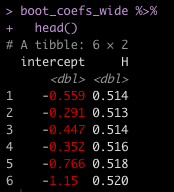
To use these bootstrapped samples for prediction I will first extract the model coefficients and then structure them in a wide data frame.

boot_coefs_wide <- boot_coefs %>%
  unnest(coefs) %>%
  select(term, estimate) %>%
  mutate(term = case_when(term == "(Intercept)" ~ "intercept",
                          TRUE ~ term)) %>%
  pivot_wider(names_from = term,
                  values_from = estimate,
              values_fn = 'list') %>%
  unnest(cols = everything())

boot_coefs_wide %>%
  head()


In a previous blog I talked about three types of predictions (as indicated in Gelman & Hill’s Regression and Other Stories) we might choose to make from our models:

  1. Point prediction
  2. Point prediction with uncertainty
  3. A predictive distribution for a new observation in the population

Let’s say we observe a new batter with 95 Hits on the season. How many Runs would we expect this batter to have?

To do this, I will apply the new batters 95 hits to the coefficients for each of the bootstrapped regression models, producing 1000 estimates of Runs for this hitter.

new_H <- 95

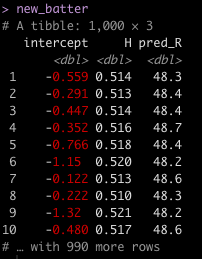
new_batter <- boot_coefs_wide %>%
  mutate(pred_R = intercept + H * new_H)

new_batter


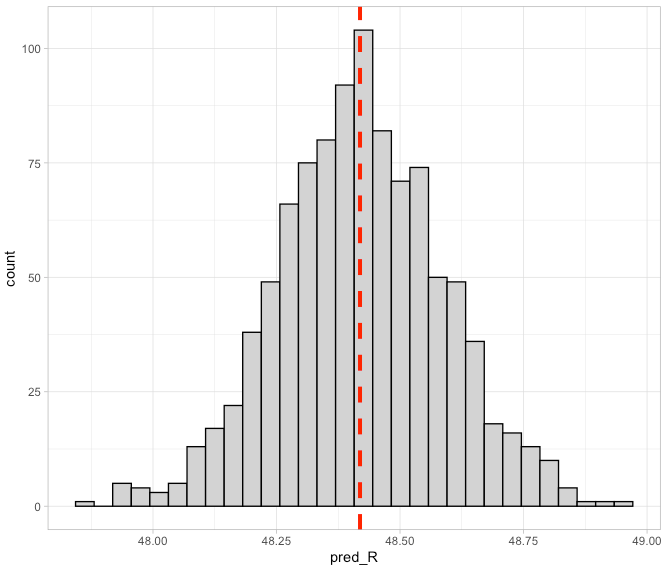
We can plot the distribution of these estimates.

## plot the distribution of predictions
new_batter %>%
  ggplot(aes(x = pred_R)) +
  geom_histogram(color = "black",
                 fill = "light grey") +
  geom_vline(aes(xintercept = mean(pred_R)),
             color = "red",
             linetype = "dashed",
             size = 1.4)

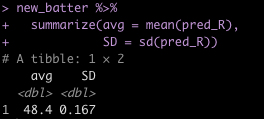
Next, we can get our point prediction by taking the average and standard deviation over the 1000 estimates.

## mean and standard deviation of bootstrap predictions
new_batter %>%
  summarize(avg = mean(pred_R),
            SD = sd(pred_R))

We can compare this to the predicted value and standard error from the original linear model.

## compare to linear model
predict(fit_lm, newdata = data.frame(H = new_H), se = TRUE)

Pretty similar!

For making predictions about uncertainty we can make predictions either at the population level, saying something about the average person in the population (point 2 above) or at the individual level (point 3 above). The former would require us to calculate the Confidence Interval while the latter would require the Prediction Interval.

(NOTE: If you’d like to read more about the different between Confidence and Prediction Intervals, check out THIS BLOG I did, discussing both from a Frequentist and Bayesian perspective).

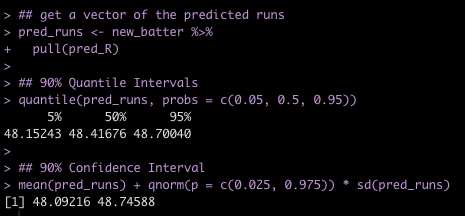
We’ll start by extracting the vector of estimated runs and then calculating 90% Quantile Intervals and 90% Confidence Intervals.

## get a vector of the predicted runs
pred_runs <- new_batter %>% 
  pull(pred_R)

## 90% Quantile Intervals
quantile(pred_runs, probs = c(0.05, 0.5, 0.95))

## 90% Confidence Interval
mean(pred_runs) + qnorm(p = c(0.025, 0.975)) * sd(pred_runs)


We can compare the 90% Confidence Interval of our bootstrapped samples to that of the linear model.

## Compare to 90% confidence intervals from linear model
predict(fit_lm, newdata = data.frame(H = new_H), interval = "confidence", level = 0.90)


Again, pretty close!

Now we are ready to create prediction intervals. This is a little tricky because we need the model sigma from each of the bootstrapped models. The model sigma is represented as the Residual Standard Error in the original linear model output. Basically, this informs us about how much error there is in our model, indicating how far off our predictions might be. In this case, our predictions are, on average, off by about 10.87 Runs.

To extract this residual standard error value for each of the bootstrapped resamples, we will use the glance() function from the {broom} package, which produces model fit variables. Again, we use the map() function to loop over each of the bootstrapped models, extracting sigma.

boot_sigma <- fit_boot %>%
  mutate(coefs = map(model, glance)) %>%
  unnest(coefs) %>%
  select(id, sigma)

Next, we’ll recreate the previous wide data frame of the model coefficients but this time we retain the bootstrap id column so that we can join the sigma value of each of those models to it.

## Get the bootstrap coefficients and the bootstrap id to join the sigma with it
boot_coefs_sigma <- boot_coefs %>%
  unnest(coefs) %>%
  select(id, term, estimate) %>%
  mutate(term = case_when(term == "(Intercept)" ~ "intercept",
                          TRUE ~ term)) %>%
  pivot_wider(names_from = term,
                  values_from = estimate,
              values_fn = 'list') %>%
  unnest(everything()) %>%
  left_join(boot_sigma)


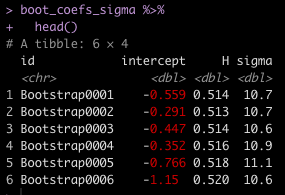
Now we have 4 columns for each of the 1000 bootstrapped samples: An Id, an intercept, a coefficient for Hits, and a residual standard error (sigma).

We make a prediction for Runs the new batter with 95 Hits. This time, we add in some model error by drawing a random number with a mean of 0 and standard deviation equal to the model’s sigma value.


## Now make prediction using a random draw with mean = 0 and sd = sigma for model uncertainty
new_H <- 95

# set seed so that the random draw for model error is replicable
set.seed(476)
new_batter2 <- boot_coefs_sigma %>%
  mutate(pred_R = intercept + H * new_H + rnorm(n = nrow(.), mean = 0, sd = sigma))

new_batter2 %>%
  head()


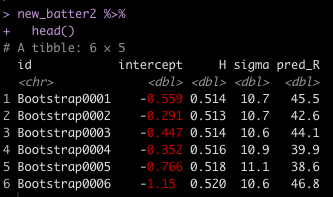
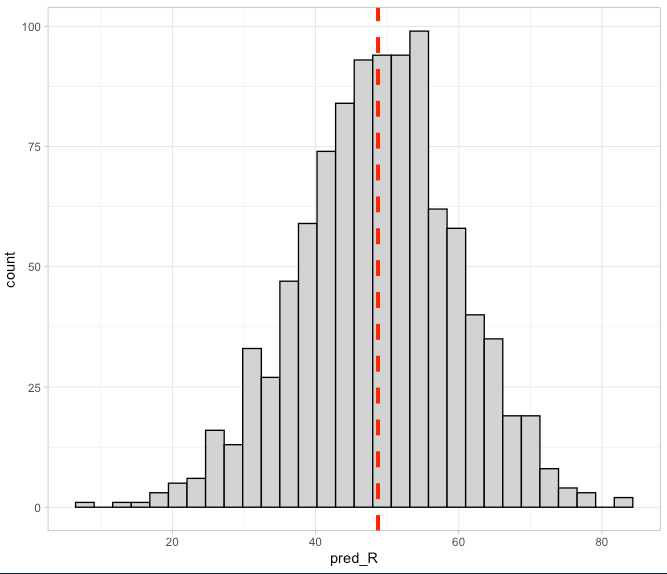
Again, we can see that we have some predicted estimates for the number of runs we might expect for this new hitter. We can take those values and produce a histogram as well as extract the mean, standard deviation, and 90% Prediction Intervals.

## plot the distribution of predictions
new_batter2 %>%
  ggplot(aes(x = pred_R)) +
  geom_histogram(color = "black",
                 fill = "light grey") +
  geom_vline(aes(xintercept = mean(pred_R)),
             color = "red",
             linetype = "dashed",
             size = 1.4)

## mean and standard deviation of bootstrap predictions
new_batter2 %>%
  summarize(avg = mean(pred_R),
            SD = sd(pred_R),
            Low_CL90 = avg - 1.68 * SD,
            High_CL90 = avg + 1.68 * SD)


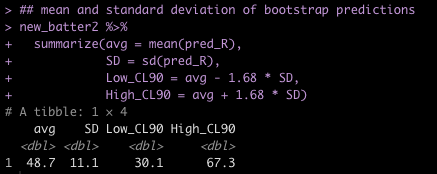
Notice that while the average number of Runs is relatively unchanged, the Prediction Intervals are much larger! That’s because we are incorporating more uncertainty into our Prediction Interval to try and say something about someone specific in the population versus just trying to make a statement about the population on average (again, check out THIS BLOG for more details).

Finally, we can compare the results from the bootstrapped models to the prediction intervals from our original linear model.

## compare to linear model
predict(fit_lm, newdata = data.frame(H = new_H), interval = "predic", level = 0.9)


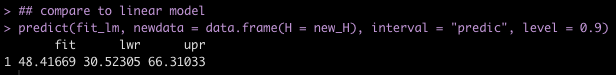
Again, pretty close to the same results!

Wrapping Up

Using things like bootstrap resampling and simulation (NOTE: They are different!) is a great way to explore uncertainty in your data and in your models. Additionally, such techniques become incredibly useful when making predictions because every prediction about the future is riddled with uncertainty and point estimates rarely ever do us any good by themselves. Finally, {tidymodels} offers a nice framework for building models and provides a number of helper functions that take a lot of the heavy lifting and coding out of your hands, allowing you to think harder about the models you are creating and less about writing for() loops and vectors.

(THIS BLOG contains my simple {tidymodels} template if you are looking to get started using the package).

If you notice any errors, please let me know!

To access the entire code for this article, please see my GITHUB page.

TidyX Episode 136: Fuzzy Joins on Dates

This week, Ellis Hughes and I dig into the mailbag and respond to a viewers question regarding Fuzzy Joining with dates. We’ve previously done two episodes on Fuzzy Joining for names ( Episode 127 & Episode 132) but the viewer brought up an interesting scenario (common in sports science) where you might be trying to match the date of a discrete test with a series of days within a window of time either before or after that test date. So, we go through the ways of handling this issue and build a function to specify the type of matching you might be interested in.

To watch the screen cast, CLICK HERE.

To access our code, CLICK HERE.

Bayesian Priors for Categorical Variables using rstanarm

Continuing with more Bayesian data analysis using the {rstanarm} package, today walk through the ways of setting priors on categorical variables.

NOTE: Priors are a pretty controversial piece in Bayesian statistics and one of the arguments people make against Bayesian data analysis. Thus, I’ll also show what happens when you are overly bullish with your priors/

The full code is accessible on my GITHUB page.

Load Packages & Data

We are going to use the mtcars data set from R. The cylinder variable (cyl) is read in as a numeric but it only have three levels (4, 6, 8), therefore, we will convert it to a categorical variable and treat it as such for the analysis.

We are going to build a model that estimates miles per gallon (mpg) from the number of cylinders a  car has. So, we will start by looking at the mean and standard deviation of mpg for each level of cyl.

## Bayesian priors for categorical variables using rstanarm

library(rstanarm)
library(tidyverse)
library(patchwork)

### Data -----------------------------------------------------------------
d <- mtcars %>%
  select(mpg, cyl, disp) %>%
  mutate(cyl = as.factor(cyl),
         cyl6 = ifelse(cyl == "6", 1, 0),
         cyl8 = ifelse(cyl == "8", 1, 0))

d %>% 
  head()

d %>%
  group_by(cyl) %>%
  summarize(avg = mean(mpg),
            SD = sd(mpg))

Fit the model using Ordinary Least Squares regression

Before constructing our Bayesian model, we fit the model as a basic regression model to see what the output looks like.

## Linear regression ------------------------------------------------------
fit_lm <- lm(mpg ~ cyl, data = d)
summary(fit_lm)

  • The model suggests there is a relationship between mpg and cyl number
  • A 4 cyl car is represented as the intercept. Consequently, the intercept represents the average mpg we would expect from a 4 cylinder car.
  • The other two coefficients (cyl6 and cyl8) represent the difference in mpg for each of those cylinder cars relative to a 4 cylinder car (the model intercept). So, a 6 cylinder can, on average, will get 7 less mpg than a 4 cylinder car while an 8 cylinder car will, on average, get about 12 less mpg’s than a 4 cylinder car.

Bayesian regression with rstanarm — No priors specified

First, let’s fit the model with no priors specified (using the functions default priors) to see what sort of output we get.

## setting no prior info
stan_glm(mpg ~ cyl, data = d) %>%
  summary(digits = 3)

  • The output is a little different than the OLS model. First we see that there are no p-values (in the spirit of Bayes analysis!).
  • We do find that the model coefficients are basically the same as those produce with the OLS model and even the standard deviation is similar to the standard errors from above.
  • Instead of p-values for each coefficient we get 80% credible intervals.
  • The sigma value at the bottom corresponds to the residual standard error we got in our OLS model.

Basically, the default priors “let the data speak” and reported back the underlying relationship in the empirical data.

Setting Some Priors

Next, we can set some minimally informative priors. These priors wont contain much information and, therefore, will be highly influenced by minimal amounts of evidence regarding the underlying relationship that is present in the data.

To set priors on independent variables in rstanarm we need to create an element to store them. We have two independent variables (cyl6 and cyl8), both requiring priors (we will set the prior for the intercept and the model sigma in the function directly). To set these priors we need to determine a distribution, a mean value (location), and a standard deviation (scale). We add these values into the distribution function in the order in which they will appear in the model. So, there will be a vector of location that is specific to cyl6 and cyl8 and then a vector of scale that is also specific to cyl6 and cyl8, in that order.

## Setting priors
ind_var_priors <- normal(location = c(0, 0), scale = c(10, 10))

Next, we run the model.

fit_rstan <- stan_glm(mpg ~ cyl, 
                      prior = ind_var_priors,
                      prior_intercept = normal(15, 8),
                      prior_aux = cauchy(0, 3),
                      data = d)

# fit_rstan
summary(fit_rstan, digits = 3)

Again, this model is not so different from the one that used the default priors (or from the findings of the OLS model). But, our priors were uninformative.

One note I’ll make, before proceeding on, is that you can do this a different way and simply dummy code the categorical variables and enter those dummies directly into the model, setting priors on each, and you will obtain the same result. The below code dummy codes cyl6 and cyl8 as booleans (1 = yes, 0 = no) so when both are 0 we effectively are left with cyl4 (the model intercept).

############################################################################################
#### Alternate approach to coding the priors -- dummy coding the categorical variables #####
############################################################################################

d2 <- d %>%
  mutate(cyl6 = ifelse(cyl == "6", 1, 0),
         cyl8 = ifelse(cyl == "8", 1, 0))

summary(lm(mpg ~ cyl6 + cyl8, data = d2))

stan_glm(mpg ~ cyl, 
         prior = ind_var_priors,
         prior_intercept = normal(15, 8),
         prior_aux = cauchy(0, 3),
         data = d2) %>%
  summary()

###########################################################################################
###########################################################################################

Okay, back to our regularly scheduled programming…..

So what’s the big deal?? The model coefficients are relatively the same as with OLS. Why go through the trouble? Two reasons:

  1. Producing the posterior distribution of model coefficients posterior predictive distribution for the dependent variable allows us to evaluate our uncertainty around each. I’ve talked a bit about this before (Making Predictions with a Bayesian Regression Model, Confidence & Prediction Intervals – Compare and Contrast Frequentist and Bayesian Approaches, and Approximating a Bayesian Posterior with OLS).
  2. If we have more information on relationship between mpg and cylinders we can code that in as information the model can use!

Let’s table point 2 for a second and extract out some posterior samples from our Bayesian regression and visualize the uncertainty in the coefficients.

# posterior samples
post_rstan <- as.matrix(fit_rstan) %>%
  as.data.frame() %>%
  rename('cyl4' = '(Intercept)')

post_rstan %>%
  head()

mu.cyl4 <- post_rstan$cyl4
mu.cyl6 <- post_rstan$cyl4 + post_rstan$cyl6
mu.cyl8 <- post_rstan$cyl4 + post_rstan$cyl8

rstan_results <- data.frame(mu.cyl4, mu.cyl6, mu.cyl8) %>%
  pivot_longer(cols = everything())


rstan_plt <- rstan_results %>%
  left_join(
    
    d %>%
      group_by(cyl) %>%
      summarize(avg = mean(mpg)) %>%
      rename(name = cyl) %>%
      mutate(name = case_when(name == "4" ~ "mu.cyl4",
                              name == "6" ~ "mu.cyl6",
                              name == "8" ~ "mu.cyl8"))
    
  ) %>%
  ggplot(aes(x = value, fill = name)) +
  geom_histogram(alpha = 0.4) +
  geom_vline(aes(xintercept = avg),
             color = "black",
             size = 1.2,
             linetype = "dashed") +
  facet_wrap(~name, scales = "free_x") +
  theme_light() +
  theme(strip.background = element_rect(fill = "black"),
        strip.text = element_text(color = "white", face = "bold")) +
  ggtitle("rstanarm")

rstan_plt

  • The above plot represents the posterior distribution (the prior combined with the observed data, the likelihood) of the estimated values for each of our cylinder types.
  • The dashed line is the observed mean mpg for each cylinder type in the data.
  • The distribution helps give us a good sense of the certainty (or uncertainty) we have in our estimates.

We can summarize this uncertainty with point estimates (e.g., mean and median) and measures of spread (e.g., standard deviation, credible intervals, quantile intervals).


# summarize posteriors
mean(mu.cyl4)
sd(mu.cyl4)
qnorm(p = c(0.05, 0.95), mean = mean(mu.cyl4), sd = sd(mu.cyl4))
quantile(mu.cyl4, probs = c(0.05, 0.25, 0.5, 0.75, 0.95))

mean(mu.cyl6)
sd(mu.cyl6)
qnorm(p = c(0.05, 0.95), mean = mean(mu.cyl6), sd = sd(mu.cyl6))
quantile(mu.cyl6, probs = c(0.05, 0.25, 0.5, 0.75, 0.95))

mean(mu.cyl8)
sd(mu.cyl8)
qnorm(p = c(0.05, 0.95), mean = mean(mu.cyl8), sd = sd(mu.cyl8))
quantile(mu.cyl8, probs = c(0.05, 0.25, 0.5, 0.75, 0.95))

For example, the below information tells us that cyl8 cars will, on average, provide us with ~15.2 mpg with a credible interval between 13.7 and 16.2. The median value is 15.2 with an interquartile range between 14.6 and 15.8 and a 90% quantile interval ranging between 13.7 and 16.6.

Bullish Priors

As stated earlier, priors are one of the most controversial aspects of Bayesian analysis. Most argue against Bayes because they feel that priors can be be manipulated to fit the data. However, what many fail to recognize is that no analysis is void of human decision-making. All analysis is done by humans and thus there are a number of subjective decisions that need to be made along the way, such as deciding on what to do with outliers, how to handle missing data, the alpha level or level of confidence that you want to test your data against, etc. As I’ve said before, science isn’t often as objective as we’d like it to be. That all said, selecting priors can be done in a variety of ways (aside from just using non-informative priors as we did above). You could get expert opinion, you could use data and observations gained from a pilot study, or you can use information about parameters from previously conducted studies (though be cautious as these also might be bias due to publication issues such as the file drawer phenomenon, p-hacking, and researcher degrees of freedom).

When in doubt, it is probably best to be conservative with your priors. But, let’s say we sit down with a mechanic and inform him of a study where we are attempting to estimate the miles per gallon for 4, 6, and 8 cylinder cars. We ask him if he can help us with any prior knowledge about the decline in mpg when the number of cylinders increase. The mechanic is very bullish with his prior information and states,

“Of course I know the relationship between cylinders and miles per gallon!! Those 4 cylinder cars tend to be very economical and get around 50 mpg plus or minus 2. I haven’t seen too many 6 cylinder cars, but my hunch is that there are pretty similar to the 4 cylinder cars. Now 8 cylinder cars…I do a ton of work on those! Those cars get a bad wrap. In my experience they actually get better gas mileage than the 4 or 6 cylinder cars. My guess would be that they can get nearly 20 miles per gallon more than a 4 cylinder car!”

Clearly our mechanic has been sniffing too many fumes in the garage! But, let’s roll with his beliefs and codify them as prior knowledge for our model and see how such bullish priors influence the model’s behavior.

  • We set the intercept to be normally distributed with a mean of 50 and a standard deviation of 2.
  • Because the mechanic felt like the 6 cylinder car was similar to the 4 cylinder car we will stick suggest that the difference between 6 cylinders and 4 cylinders is normally distributed with a mean of 0 and standard deviation of 2.
  • Finally, we use the crazy mechanics belief that the 8 cylinder car gets roughly 20 more miles per gallon than the 4 cylinder car and we code its prior to be normally distributed with a mean of 20 and standard deviation of 5.

Fit the model…


## Use wildly different priors ---------------------------------------------------------
ind_var_priors2 <- normal(location = c(0, 20), scale = c(10, 5))

fit_rstan2 <- stan_glm(mpg ~ cyl, 
                       prior = ind_var_priors2,
                       prior_intercept = normal(50, 2),
                       prior_aux = cauchy(0, 10),
                       data = d)

summary(fit_rstan2, digits = 3)


Wow! Look how much the overly bullish/informative priors changed the model output.

  • Our new belief is that a 4 cylinder car gets approximately 39 mpg and the 6 cylinder car gets about 3 more mpg than that, on average.
  • The 8 cylinder car is now getting roughly 14 mpg more than the 4 cylinder car.

The bullish priors have overwhelmed the observed data. Notice that the results are not exact to the prior but the prior, as they are tugged a little bit closer to the observed data, though not by much. For example, we specified the 8 cylinder car to have about 20 mpg over a 4 cylinder car. The observed data doesn’t indicate this to be true (8 cylinder cars were on average 11 mpg LESS THAN a 4 cylinder car) so the coefficient is getting pulled down slightly, from our prior of 20 to 14.4.

Let’s plot the posterior distribution.

# posterior samples
post_rstan <- as.matrix(fit_rstan2) %>%
  as.data.frame() %>%
  rename('cyl4' = '(Intercept)')

post_rstan %>%
  head()

mu.cyl4 <- post_rstan$cyl4
mu.cyl6 <- post_rstan$cyl4 + post_rstan$cyl6
mu.cyl8 <- post_rstan$cyl4 + post_rstan$cyl8

rstan_results <- data.frame(mu.cyl4, mu.cyl6, mu.cyl8) %>%
  pivot_longer(cols = everything())


rstan_plt2 <- rstan_results %>%
  left_join(
    
    d %>%
      group_by(cyl) %>%
      summarize(avg = mean(mpg)) %>%
      rename(name = cyl) %>%
      mutate(name = case_when(name == "4" ~ "mu.cyl4",
                              name == "6" ~ "mu.cyl6",
                              name == "8" ~ "mu.cyl8"))
    
  ) %>%
  ggplot(aes(x = value, fill = name)) +
  geom_histogram(alpha = 0.4) +
  geom_vline(aes(xintercept = avg),
             color = "black",
             size = 1.2,
             linetype = "dashed") +
  facet_wrap(~name, scales = "free_x") +
  theme_light() +
  theme(strip.background = element_rect(fill = "black"),
        strip.text = element_text(color = "white", face = "bold")) +
  ggtitle("rstanarm 2")

rstan_plt2

Notice how different these posteriors are than the first Bayesian model. In every case, the predicted mpg from the number of cylinders are all over estimating the observed mpg by cylinder (dashed line).

Wrapping Up

Today we went through how to set priors on categorical variables using rstanarm. Additionally, we talked about some of the skepticism about priors and showed what can happen when the priors you select are too overconfident. The morale of the story is two-fold:

  1. All statistics (Bayes, Frequentist, Machine Learning, etc) have some component of subjectivity as the human doing the analysis has to make decisions about what to do with their data at various points.
  2. Don’t be overconfident with your priors. Minimally informative priors maybe be useful to allowing us to assert some level of knowledge of the outcome while letting that knowledge be influenced/updated by what we’ve just observed.

The full code is accessible on my GITHUB page.

If you notice any errors, please reach out!


TidyX Episode 134: Conditional Formatting DT tables

Last week, a viewer sent us a request via the YouTube channel asking if we could go over various ways of conditioning formatting DT tables.

We use DT a lot, especially in shiny apps, flexdahboards, and Rmarkdown reports. DT is my preferred table package when I need to make interactive tables that allow the user to sort and filter data. Conditional formatting is pretty easy in DT and this week, Ellis and I talk through using the basic functions, styleEqual() and styleInterval() to create conditionally formatted columns. We also go through more advanced conditional formatting features such as gradient conditional formatting and conditionally formatting entire rows based on the conditions of a single column.

To watch our screen cast, CLICK HERE.

To access our code, CLICK HERE.