Models are built for different reasons. Some models are built to make inferences and explore an underlying phenomenon while other models are built for making predictions and forecasting future outcomes. Often, in the applied sport science setting, the latter is a key goal as we are interested in future predictions that can assist practitioners in making decisions about training or treatment interventions.
I’ve previously discussed building and interpreting mixed models using R (see HERE and HERE). Therefore, today, I wanted to talk about making predictions with mixed models. We will do this in R using the mixed model packages {lme4} and walk through how to use the predict() function and other helper functions to extract confidence intervals and predictions intervals. First, I’ll briefly cover the predict() function using a simple linear regression so that we have a general understanding of how it works and what it does before we get into the mixed models (as a side note, I’ve previously talked about making predictions using Bayesian models here).
Data
As with my previous article on mixed models, I’ll be using the sleepstudy data set, which is freely available in the {lme4} package. It’s a convenient data set to use for this project because it has repeated measurements of reaction time during increasing days of sleep deprivation for multiple subjects. Additionally, the role that sleep plays in sport performance is an important topic that is frequently discussed on social media. Therefore, practitioners might be handling similar wearable tracking data for the groups of athletes they work with.
## Load Packages & Data
library(tidyverse)

dat <- lme4::sleepstudy
Simple Linear Regression
For the purposes of building the model from the ground up, we will create a simple linear regression that acts as if we don’t have repeated measurements on individuals. This model will regress the dependent variable, Reaction, on the independent variable, Days.
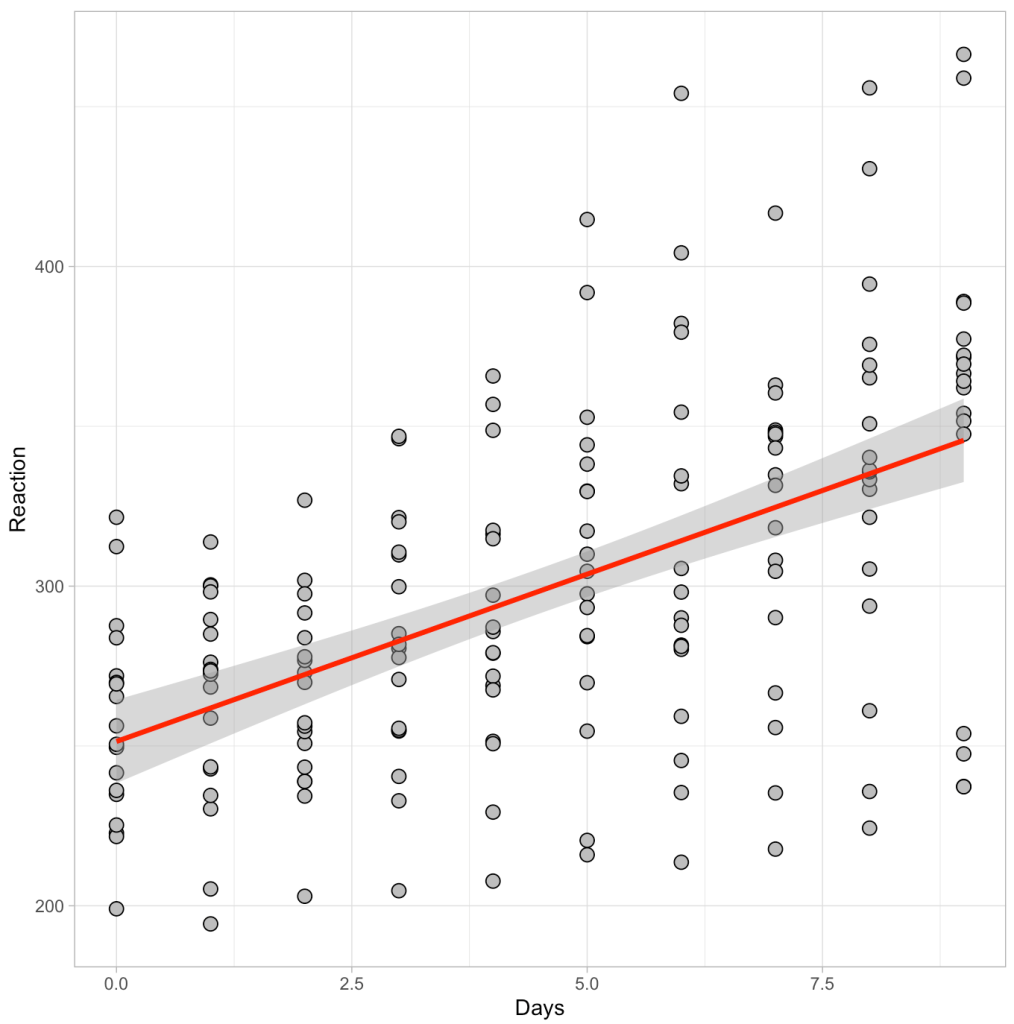
Below we see a plot of the data as well as the output of the regression model.
# plot of the data
dat %>%
  ggplot(aes(x = Days, y = Reaction)) +
  geom_point(size = 3,
              shape = 21,
              fill = "grey",
              color = "black") +
  geom_smooth(method = "lm",
              color = "red",
              size = 1.2)

# regression
fit_ols <- lm(Reaction ~ Days, data = dat)
summary(fit_ols)
Visually we can see a linear relationship indicating that for every additional day of sleep deprivation there is a corresponding increase in Reaction time (IE, the people react slower and become more impaired). The model output tells us that this increase is on the magnitude of roughly 10.5 milliseconds (the beta coefficient for the Days variable). Thus, for every one day increase in sleep deprivation we see a 10.5 millisecond increase in Reaction time, on average (for this population that was tested).
Making a prediction with the linear model
What if we were interested in predicting the expected reaction time following 5 days of sleep deprivation? We could do this with the predict() function and we find that we expect the reaction time to be about 304 milliseconds, on average.
This is the same as if we used the coefficients from the above model and multiplied the Days coefficient (10.5) by 5 days:
While this may be the average value of reaction time after 5 days of sleep deprivation we can clearly see from our plot above that there is a considerable amount of dispersion around the regression line. If we are interested in understanding the dispersion around this average estimate at the population level, we might use a confidence interval. Alternatively, if we’d like to understand this dispersion at an individual participant level, we might instead use a prediction interval. I’ve discussed the differences between these two in a prior blog article (see here).
Within the predict function we can pass the interval argument to indicate whether we want confidence or prediction intervals. Additionally, the level argument specifies what level of interval we are interested (e.g., 90%, 95%, 99%, etc).
Below we see the output for a 90% Confidence Interval and a 90% Prediction Interval. Notice that the average value (fit) is the same for both. However, the prediction interval has a much larger 90% width than the confidence interval. For all the details about why this is and the gory calculations behind them, see my previous blog post.

Finally, if we use the predict() function and set the argument se.fit to TRUE, we obtain the fitted value and 90% confidence interval (as seen above) along with the standard error and the model degrees of freedom.
The results are returned in a named list, thus we can extract the standard error and calculate the 90% confidence interval directly. We determine the upper and lower 90% confidence limits by multiplying the t-critical value to the standard error. The t-critical value is determined using a t-distribution with 178 degrees of freedom (180 observations minus 2, since our model has 2 parameters: an intercept and a slope). We then add/subtract the confidence limits from our average predicted value.
# Build the 90% confidence interval with the standard error
predict(fit_ols, newdata = data.frame(Days = 5)) + qt(p = c(0.05, 0.95), df = nrow(dat) - 2) * predict(fit_ols, newdata = data.frame(Days =5), interval = 'confidence', level = 0.90, se.fit = TRUE)$se.fit

We find that we obtain the exact same results. Fortunately, R makes it relatively easy to build a model and make predictions, so we don’t need to go through all those steps every time. I was mainly just providing them in the instance that you might need to extract values specifically from the model predictions.
Now that we have the basics down, let’s extend this to a mixed model and see what happens when we account for repeated measurements on each participant and what that does to our model predictions.
Mixed Model
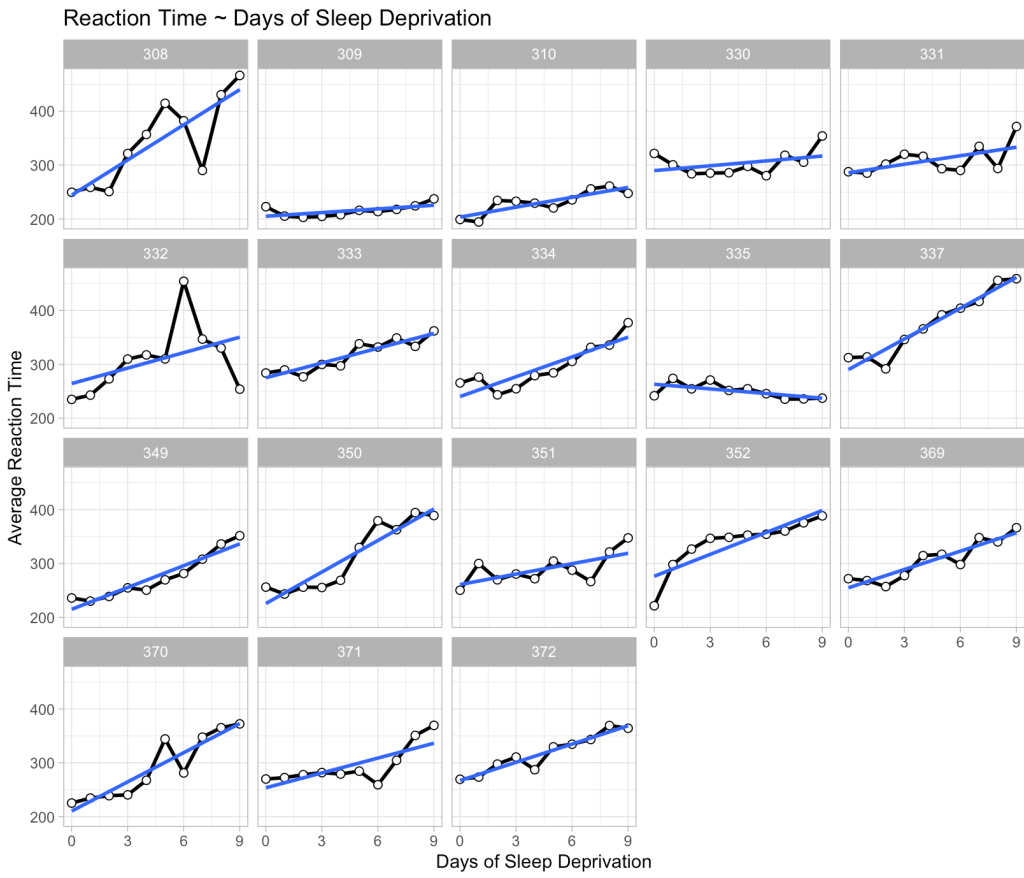
To being, we can plot the data for each individual to show that there are a bunch of individual responses to days of sleep deprivation. Then, we construct a mixed model (the same one built in my previous article) where we extend the linear regression above to incorporate random intercepts for each individual. Basically, what this means is that we retain the same linear relationship from the model above; however, the random effect now understands that there are several observations for each participant, meaning that those observations have some correlation to each other (within individual). So, we allow the intercept of the linear regression model to vary by the participant based on the information we can glean from their data.
Similar to the linear regression model, for every 1 day increase in sleep deprivation we see, on average, a 10.5 millisecond increase in reaction time. However, notice the standard error around the Days coefficient! In the linear regression model it was 1.24 and we have now shrunk it to 0.804. This is due to accounting for the repeated measures of the data. We can see in the Random Effects portion of the model output how much of the variance is contained between subjects, around the (Intercept), and how much of the variance is left unexplained (Residual).
We can look explicitly at how each individual behaves within the model with the ranef() function, which gives us the difference between the individual and the model intercept (251.4). Alternatively, we can use the coef() function to indicate the linear equation for each participant. This is the model intercept plus the random effect, which we found with the ranef() function. Also notice that since this is not a random slope model, the Days coefficient is the same for each participant.
Making Predictions with a Mixed Model
Making predictions with the mixed model can be a little tricky. We don’t only have the linear regression component of the model (often referred to as the fixed effects), but we also have a component that references specific individuals. Additionally, it’s not as easy as just extracting confidence or predictions intervals, as we did before.
Making point estimate predictions
The easiest thing to do is to simply disregard the random effects in the model by passing the predict() function the argument re.form = NA. Doing so indicates that at five days of sleep deprivation we see, on average, a 304 millisecond increase in Reaction time (similar to the linear model above).

If we are making a prediction for one of the specific participants in our data, for example Subject 308, we can include this in the predict() function by specifying that we want to use the random effects that were previously set. We do this with the re.form argument and pass it the exact random effect that we specified when we built the model.

Now we see the point estimate prediction is different than the one above it because the prediction contains some information that is known about Subject 308.
What if we have new participant that the model has no information on?
Using the allow.new.levels argument we can tell the model that we want to allow new random effect levels. In doing so, since the model has no information about the new participant, it will simply return the fixed effects point estimate, just as we got when we specified no random effects in the prediction. This is because the model’s best guess for a new participant is the population average for 5 days of sleep deprivation.

Finally, we can take these point estimate predictions and predict with only the fixed effects and then with the random effects for every participant in our data and then plot the results.
# Make predictions using fixed effect only and then random effects and plot the results
dat %>%
  mutate(pred_fixef = predict(fit_lme, newdata = ., re.form = NA),
         pred_ranef = predict(fit_lme, newdata = ., re.form = ~(1|Subject))) %>%
  ggplot(aes(x = Days, y = Reaction)) +
  geom_point(shape = 21,
             size = 2,
             color = "black",
             fill = "grey") +
  geom_line(aes(y = pred_fixef),
            color = "blue",
            size = 1.2) +
  geom_line(aes(y = pred_ranef),
            color = "green",
            size = 1.2) +
  facet_wrap(~Subject) +
  scale_x_continuous(labels = seq(from = 0, to = 9, by = 3),
                     breaks = seq(from = 0, to = 9, by = 3)) +
  labs(x = "Days of Sleep Deprivation",
       y = "Average Reaction Time",
       title = "Reaction Time ~ Days of Sleep Deprivation",
       subtitle = "Blue = Fixed Effects Prediction | Green = Random Effects Prediction")
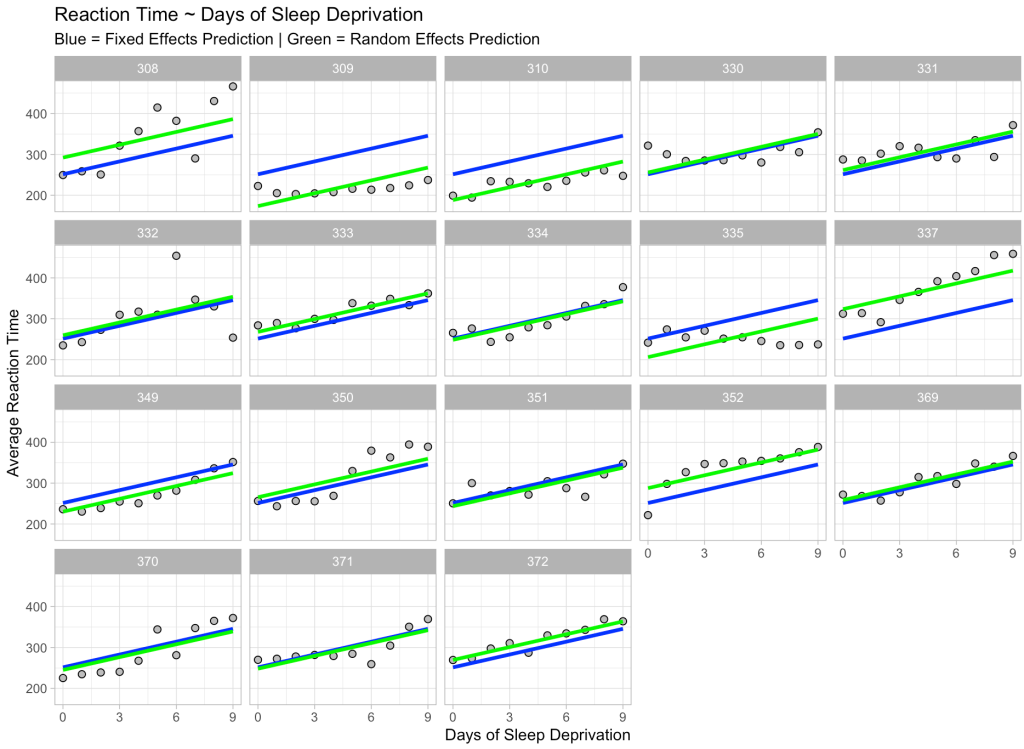
We see our fixed effects predictions in blue (which are the same for every participant) and our predictions incorporating random effects in green, which move up and down based on the participant. Also notice that the slope is exactly the same for each participant and each prediction. This is because we only specified a random intercept for this model, which is why the green line moves up and down relative to the fixed effects blue line, given that some participants are higher or lower than the population.
Confidence Intervals
To obtain confidence intervals, we can’t simply specify the interval argument in the predict() function as we did with linear regression. Instead, we need to bootstrap the predictions using the bootMer() function. (NOTE: If you want to always be able to replicate your confidence interval results be sure to set.seed() prior to running the function).
boot_ci <- bootMer(fit_lme,
                   nsim = 100,
                   FUN = function(x) { predict(x, newdata = data.frame(Days = 5), re.form = NA) })

boot_ci
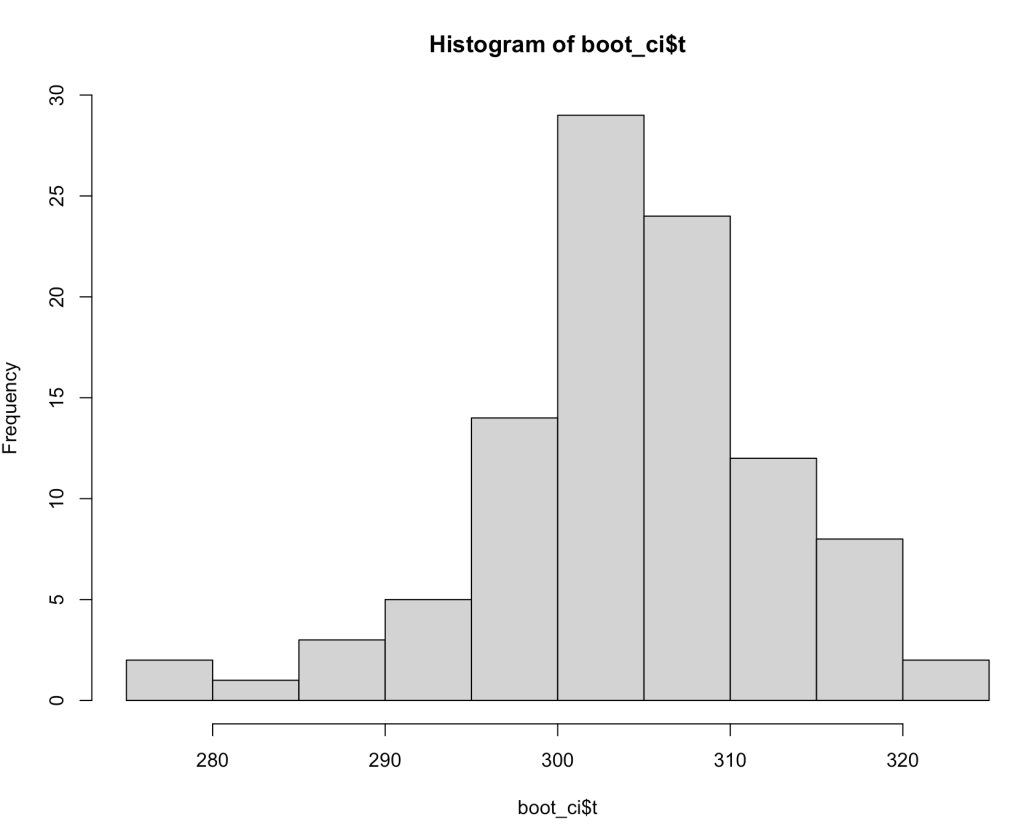
The boot_ci element that we created has a number of different parameters contained within it. The ‘t‘ parameter contains the 100 bootstrapped resamples that we created.
With these bootstrapped resamples we can do a number of things such as plotting a histogram.
Or extracting information such as the quantiles, quantile intervals, the standard deviation of the bootstrapped resamples, and using the mean and standard deviation of the reamples to build 90% confidence intervals around the point estimate prediction.
Prediction Intervals
We can create prediction intervals around our point estimate predictions using the merTools package and the predictInterval() function.
With the predictInterval() function we need to specify a Subject, since that is what the original mixed model also had in its equation (as a random effect). Here I’ll specify a new subject that the model has never seen. The model will return prediction intervals for the point estimate prediction using only fixed effects given that it doesn’t have data on this subject (it will also let me know this in the warning).

Of course, if we are making a prediction on a subject that the model is familiar with, we can use that information. Here I make a prediction on Subject 308 and we see that the results differ from above.

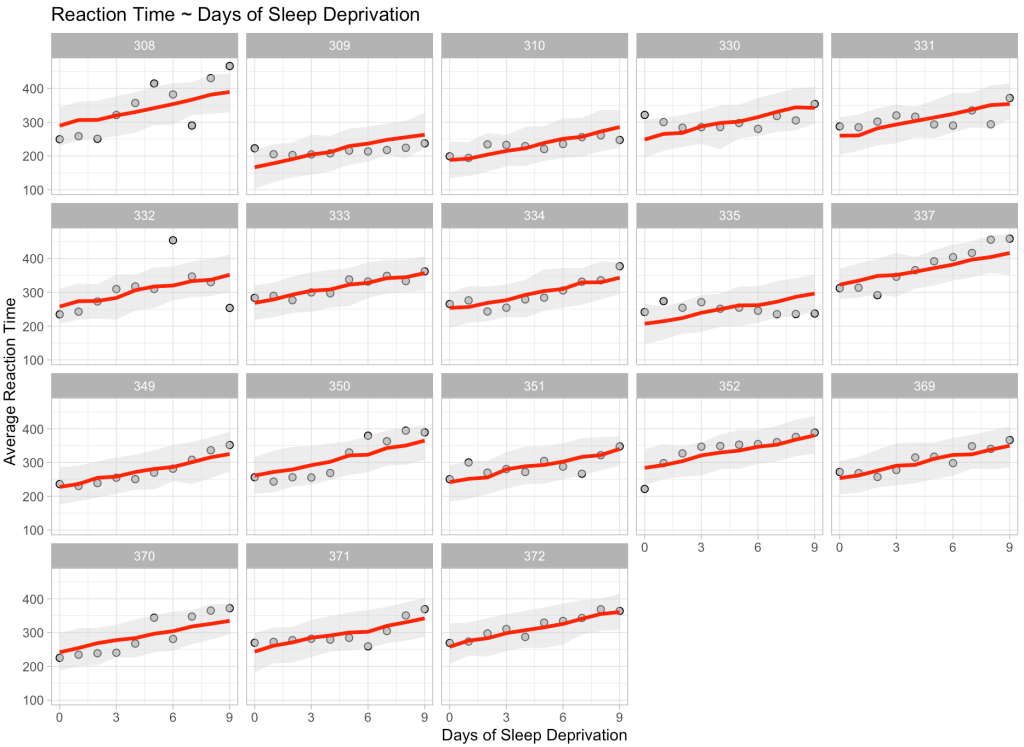
Finally, just for fun and to show we can do this at scale, we will make a prediction on every single participant in our data across all of the days of sleep deprivation. We will bind those predictions and their corresponding 90% prediction intervals to the original data and then plot the results.
pred_ints <- predictInterval(fit_lme,
                newdata = dat,
                n.sims = 100,
                returnSims = TRUE,
                seed = 123,
                level = 0.90)

dat_new <- cbind(dat, pred_ints) dat_new %>%
  head()

# plot predictions
dat_new %>%
  ggplot(aes(x = Days, y = Reaction)) +
  geom_point(shape = 21,
             size = 2,
             color = "black",
             fill = "grey") +
  geom_ribbon(aes(ymin = lwr, ymax = upr),
            fill = 'light grey',
            alpha = 0.4) +
  geom_line(aes(y = fit),
            color = 'red',
            size = 1.2) +
  facet_wrap(~Subject) +
  scale_x_continuous(labels = seq(from = 0, to = 9, by = 3),
                     breaks = seq(from = 0, to = 9, by = 3)) +
  labs(x = "Days of Sleep Deprivation",
       y = "Average Reaction Time",
       title = "Reaction Time ~ Days of Sleep Deprivation")
Wrapping Up
Mixed models are an incredibly valuable analysis tools. In sport medicine and sport science, models are often helpful for allowing practitioners to make forecasts about how an athlete is progressing or to understand how an athlete is performing relative to what might be expected. Hopefully this article was useful in walking through how to make point estimate predictions and obtain confidence and prediction intervals from mixed models. If you notice any errors, feel free to reach out!
As always, all of the code if available on my GITHUB page.

