In our most recent TidyX screen cast we talked a bit about correlation, which compelled me to expand on Pearson’s correlation to show how you can do things from first principles in R, by writing your own custom functions. This tutorial covers:
- A brief explanation of Pearson’s correlation
- R functions available to obtain Pearson’s correlation coefficient
- How to write your own custom functions to understand the underlying principles of Pearson’s correlation coefficient and it’s confidence intervals
Pearson’s Correlation
Read almost any scientific journal article and you are sure to encounter Pearson’s correlation coefficient (denoted as r), as it is a commonly used metric for describing relationships within ones data. Take any basic stats course and you are bound to hear the phrase, “Correlation does not equal causation”, due to the fact that just because things are correlated does not mean that one definitely caused the other (such a relationship would need to be teased out of more specifically and the natural world is full of all sorts of random correlations).
Pearson’s correlation is a descriptive statistic used to quantify the linear relationship between two variables. It does so by measuring how much two variables covary with each other. The correlation coefficient is scaled between -1 and 1 where 1 means that the two variables have a perfect positive relationship (as one variable increases the other variable also always increases) while -1 means that the two variables have a perfect negative relationship (as one variable decreases the other variable also always decreases). A correlation coefficient of 0 suggests that the two variables do not share a linear relationship. It is rare that we see completely perfect correlations (either 1 or -1) and often our data will present with some scatter suggesting a specific trend (positive or negative) but with some amount of variability.
Data Preparation
R offers a few convenient functions for obtaining the correlation coefficient between two variables. For this tutorial, we will work with the Lahman baseball data set, which is freely available in R once you have installed the {Lahman} package. We will also use the {tidyverse} package for data manipulation and visualization.
We will use the Batting data set, which contains historic batting statistics for players, and the Master data set, which contains meta data on the players (e.g., birth year, death year, hometown, Major League debut, etc).
I do a little bit of data cleaning to obtain only the batting statistics from the 2016 season for those that had at least 200 at bats and I join that data with the player’s birth year from the Master data set. The two hitting variables I’ll use for this tutorial are Hits and RBI. One final thing I do is create a quantile bin for the player’s age so that I can look at correlation across age groups later in the tutorial.
Here is what the data looks like so far:

Data Visualization
Once we have pre-processed the data we can visualize it to see how things look. We will plot two visuals: (1) the number of players per age group; and, (2), a plot of the linear relationship between Hits and RBI.


Correlation in R
R offers a few convenient functions for obtaining the correlation coefficient between two variables. The two we will use are cor() and cor.test(). The only arguments you need to pass to these two functions is the X and Y variables you are interested in. The first function will produce a single correlation coefficient while the latter function will produce the correlation coefficient along with confidence intervals and information about the hypothesis test. Here is what their respective outputs looks like for the correlation between Hits and RBI:
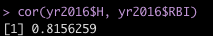

Pretty easy! We can see that the correlation coefficient is the same between both functions, as it should be (r = 0.82). In the bottom output we can see that the 95% Confidence Intervals range from r = 0.78 to r = 0.85. The correlation is high between these two variables but it is not perfect, which we can better appreciate from the scatter plot above showing variability around the regression line.
Correlation from First Principles
One of the best ways to understand what is going on behind the custom functions in your stats program (no matter if it is R, Python, SPSS, SAS, or even Excel) is to try and build your own functions by hand. Doing so gives you an appreciation for some of the inner workings of these statistics and will help you better understand more complex statistics latter on.
I’ll build two functions:
- A function to calculate the Pearson’s correlation coefficient
- A function to calculate the confidence intervals around the correlation coefficient
Pearson’s Correlation Coefficient Function
- Similar to the built in R functions, this function will take inputs of an X and Y variable.
- You can see the math for calculating the correlation coefficient in the function below. We start by subtracting the mean for each column from each observation. We then multiply the differences for each row and then produce a column of squared differences for each variable. Those values provide the inputs for the correlation coefficient in the second to last line of the function.
cor_function <- function(x, y){

  dat <- data.frame(x, y)
  dat <- dat %>%
    mutate(diff_x = x - mean(x),
           diff_y = y - mean(y),
           xy = diff_x * diff_y,
           x2 = diff_x^2,
           y2 = diff_y^2)

  r <- sum(dat$xy) / sqrt(sum(dat$x2) * sum(dat$y2))
  return(r)
}
Confidence Interval for Pearson’s R
- This function takes three inputs: (1) the correlation coefficient between two variables (calculated above); (2) the sample size (the number of observations between X and Y); and, (3) The Confidence Level of Interest.
- NOTE: To input a confidence level of interest I only set it up for three options, 0.9, 0.95, or 0.99, for the 90%, 95% and 99% Confidence Interval respectively. I could set it up to take any level of confidence and calculate the appropriate critical value but the function (as you can see) was already getting long and messy so I decided to cut it off and keep it simple for illustration purposes here.
- This function is a bit more involved than the previous one and that’s because we require some transformations of the data. We have to transform the correlation coefficient using Fisher’s Z-Transformation in order to create a normal distribution. From there we can calculate our confidence intervals and then back transform the values so that they are on the scale of r.
cor.CI <- function(r, N, CI){

  fisher.Z <- .5*log((1+r)/(1-r))

  se.Z <- sqrt(1/(N-3))

  if(CI == .9){
    MOE <- 1.65*se.Z}
  else {
    if(CI == .95){
      MOE <- 1.95*se.Z}
    else {
      if(CI ==.99){
        MOE <- 2.58*se.Z}
      else{
        NA
      }
    }
  }

  Lower.Z <- fisher.Z - MOE
  Upper.Z <- fisher.Z + MOE
  Lower.cor.CI <- (exp(2*Lower.Z)-1)/(exp(2*Lower.Z)+1)
  Upper.cor.CI <- (exp(2*Upper.Z)-1)/(exp(2*Upper.Z)+1)
  Correlation.Coefficient.CI <- data.frame(r, Lower.cor.CI, Upper.cor.CI)
  Correlation.Coefficient.CI <- round(Correlation.Coefficient.CI, 3)
  return(Correlation.Coefficient.CI)
  }
Seeing our Functions in Action


We’ve obtained similar results to what was produced from the custom R functions!
We can also look at correlation across age bins. To do this, we will use {tidyverse} so that we can group_by() the age bins that we predefined.
First with the built in R functions
- Using the built in cor.test() function we need to call the confident interval specifically from the output and specifying [1] and [2] tells R that we want the first value (lower confidence interval) and the second value (higher confidence interval), respectively.
yr2016 %>%
  group_by(AgeBin) %>%
  summarize(COR = cor(H, RBI),
            COR_Low_CI = cor.test(H, RBI)$conf.int[1],
            COR_High_CI = cor.test(H, RBI)$conf.int[2])

Now with our custom R functions
- Similar to above, we need to extract the confidence interval out of the confidence interval function’s output. In this case, if you recall, there were three outputs (correlation coefficient, Low CI, and High CI). As such, we want to indicate [2] and [3] for the lower and upper confidence interval, respectively, since that is where they are located in the model output.
yr2016 %>%
  group_by(AgeBin) %>%
  summarize(COR = cor_function(H, RBI),
            cor.CI(r = COR,
                   N = n(),
                   CI = 0.95)[2],
            cor.CI(r = COR,
                   N = n(),
                   CI = 0.95)[3])

Conclusion
Hopefully this tutorial was useful in helping you to understand Pearson’s correlation and how easy it is to write functions in R that allow us to explore our data from first principles. All of the code for this tutorial is available on my GitHub page.