Category Archives: TidyX Screen Cast

TidyX 31: NCAA Women’s Basketball Championship Tournament & reactable tables

This week, Ellis Hughes and I used this week’s TidyTuesday data set, which was NCAA Women’s Basketball Championship Tournament Finishes, to build a {reactable} table. {reactable} is an incredibly flexible R package for making interactive data tables. Our table includes using unix hex codes, sparklines, and nested results tables for each university.

To watch our screen cast, CLICK HERE.

To access our code, CLICK HERE.

TidyX 30: Twitter Scraping & Sentiment Analysis

This week, Ellis Hughes and I show how to scrape tweets using the {rtweet} package.

First, we scrape tweets containing the hashtag, Debate2020. We then walk through how to do a sentiment analysis to evaluate positive and negative sentiment based on the words used by those making the tweets and show how this sentiment varies between countries.

To watch our screen cast, CLICK HERE.

To access our code, CLICK HERE.

TidyX 29: Custom Color Palette, Stacked Bar Blot, and Mixed Models

This week, Ellis and I take a look at Himalayan Climbing Expeditions with data provided by the TidyTuesday Project.

We start by going over code from Kaylea Haynes, who set up a custom color palette to show stacked bar plots of reasons for climbing expedition terminations by decade. This approach makes the plot really come to life by using colors that are specifically extracted from a jpeg of a mountain peak.

After that, we cover a mixed effects model for evaluating the probability of death on the 10 most climbed peaks in the Himalayan mountains. Here we use the {lme4} package to construct the model and then look at model outputs using the {arm} package and visualize the random effects using the {lattice} package.

To watch the screen cast, CLICK HERE.

To obtain our code, CLICK HERE.

TidyX 28: Shiny Apps Part 3 – K-Nearest Neighbor and Reactivity

In installment three of our {shiny} dashboard from scratch series, Ellis Hughes and discuss how to use the K-Nearest Neighbor algorithm to forecast a player’s career projection for the Value Over Replacement Player (VORP) metric.

We then take this analysis and build upon our {shiny} app from the previous two weeks by walking through how to add statistical analysis to the server. This will allow you to add your analytics models to your {shiny} app so that the model runs under the hood while the user sees the output. We also go over reactivity and add an action button to give the user more control of the output they see.

The finished result is a {shiny} app with three tabs:

  1. Tab 1 shows the player stats over the past 3 years and where they rank compared to other players.
  2. Tab 2 allows the user to compare players in VORP by selecting the players they are interested in.
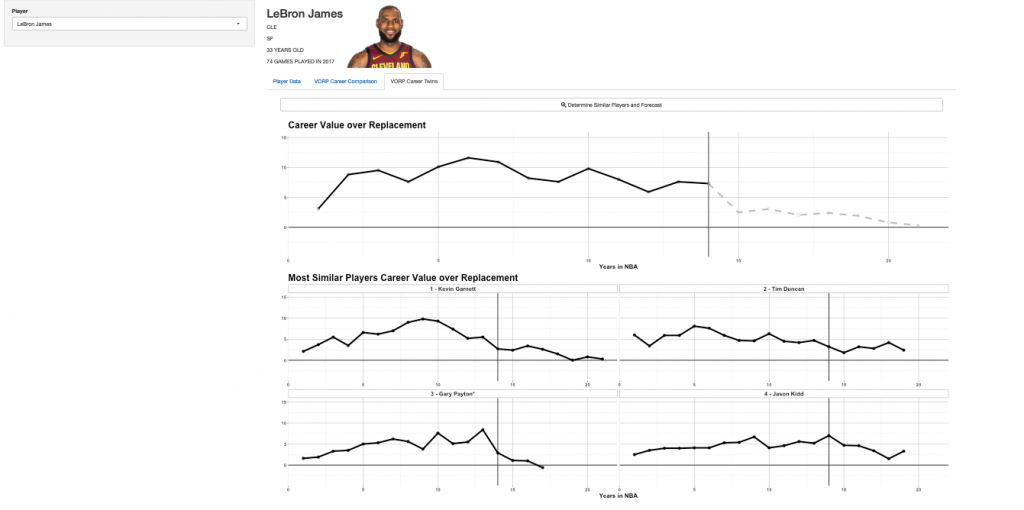
  3. Tab 3 uses K-Nearest Neighbor to forecast the rest of the player’s career by identifying the players that are most similar to in regards to how they have performed over time.

To watch the screen cast, CLICK HERE.

To access our code, CLICK HERE.

To see the previous parts of our {shiny} app development series:

Part 0.5
Part 1

Part 2

TidyX 27: Shiny Apps Part 2 – Adding Tabs and Improving UI

Ellis Hughes and I start by discussing a really cool script for developing line plots by Leon Eyrich Jessen. Leon created these plots for analyzing data from the TidyTuesday Project on the famous television show Friends.

We then continue our discussion of {shiny} web apps by showing you how to add tab panels so that you can have different pages of information within the same app and improve the user interface experience.

We extend our app from last week by adding a tab panel consisting of line plots for evaluating career comparisons between players in the Value Over Replacement Player (VORP) statistic.

To watch the screen cast, CLICK HERE.

To access our code, CLICK HERE.