Author Archives: Patrick

TidyX Episode 6: Lollipop Plots & Animations

This week on the TidyX screen cast, Ellis Hughes and I explain the lollipop plot code created by Priya Shukla, who used data on Rap album ratings supplied by the TidyTuesday Project.

After that, we take the concept of lollipop plots and apply it to data from the National Women’s Soccer league (accessed using the nwslR package) to look at home advantage and average fan attendance. We finish by creating an animated lollipop plot showing the successful shooting percentage for each team across the 2019 season.

To watch this week’s screen cast, CLICK HERE.

To access the code for this week’s episode, CLICK HERE.

R Tips & Tricks: Setting up your data to compare yesterday to today

A common question sports scientists have is, “how did something that happened yesterday effect today?” For example, the sport scientist might be interested to know how yesterday’s training load influences tomorrow’s level of subjective soreness. In this case, the data is usually offset by a day, as we will see in the example.

Rather than wasting time each day copying and pasting values in excel (and potentially making a mistake), we can use the lag() function from the tidyverse package to manipulate our data into the format we need for analysis.

In today’s R Tips & Tricks blog post I’ll walk through three different approaches to doing this, each a little more complex than the last.

First, let’s load the packages we will need to manipulate our data set.

## Load packages
library(tidyverse)
library(lubridate)

Example 1: Simple Example

First simulate some fake data

day <- 1:10
trainingLoad <- round(rnorm(n = length(day), mean = 460, sd = 60))
soreness <- round(runif(n = length(day), min = 3, max = 6), 0)
df <- data.frame(day, trainingLoad, soreness)
df

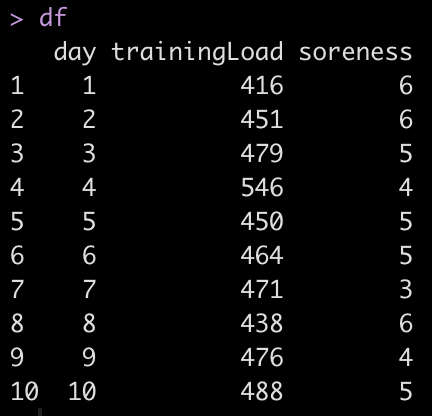
We have 10 days recorded and we want to evaluate the training load from the previous day with the soreness of the next day. For example, the training load on day 1 needs to be compared to the level of soreness the next morning, on day 2. As such, the values of interest are offset by one day.

To solve this issue we can use the lag() function for training load. What this will do is take the value one row up and move it one row down.

df %>%
  mutate(trainingLoad_lag = lag(trainingLoad))

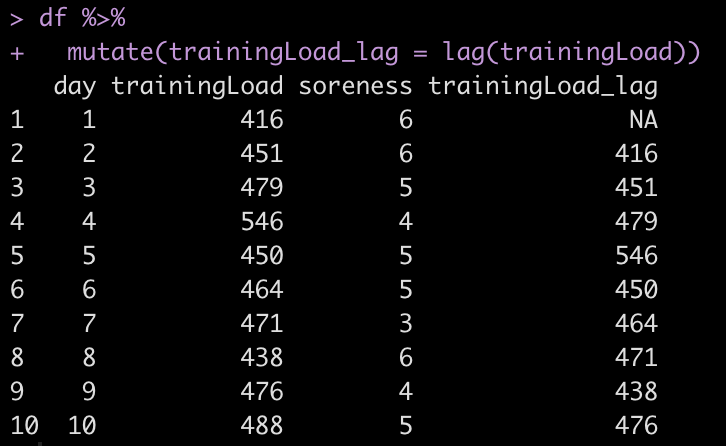
Notice that now the 416 training load units on day 1 are on the same row as the soreness on day 2 in our new column, trainingLoad_lag.

Example 2: Working Across Weeks

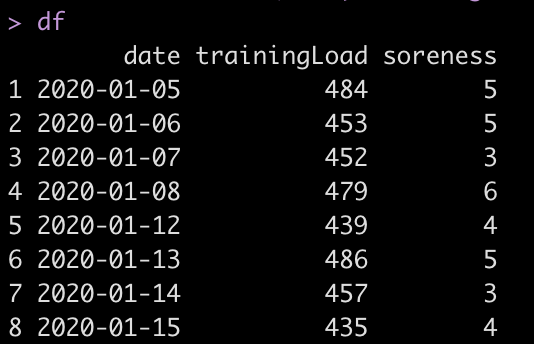
The above example is rather simple and assumes that all training and soreness reporting take place on consecutive days. Unfortunately, in real life we are often dealing with training across multiple weeks where there may be days off between training sessions.

For example, the data might look like this:

date <- c(seq(as.Date("2020/01/05"), as.Date("2020/01/08"), by = "days"),
          seq(as.Date("2020/01/12"), as.Date("2020/01/15"), by = "days"))
trainingLoad <- round(rnorm(n = length(date), mean = 460, sd = 60), 0)
soreness <- round(runif(n = length(date), min = 3, max = 6), 0)
df <- data.frame(date, trainingLoad, soreness)
df

Let’s look what happens if we blindly apply the lag() function

df %>%
  mutate(trainingLoad_lag = lag(trainingLoad))

Notice the issue here. We have a group of 4 consecutive training sessions that ends on 1/8/2020 and a second group of 4 consecutive sessions starting on 1/12/2020. As such, the lag function just works across the data set and makes the assumption that these are all consecutive days. If we analyzed this data in this fashion we might come up with strange outcomes given that the soreness experienced on 1/12/2020 might not be due to the session that happened 4 days ago on 1/8/2020.

We can solve this issue in one of two ways.

Fix #1: Always create a mesocycle variable in your data to represent the weeks. This will allow you to group_by() that variable.

mesocycle <- rep(c(1, 2), each = 4)
df <- data.frame(mesocycle, df) df # Group by Mesocycle df %>%
  group_by(mesocycle) %>%
  mutate(trainingLoadlag = lag(trainingLoad))

After adding the mesocycle variable and then using it the group_by() function we achieve the correct data manipulation where day 1 of each of the training mesocycles starts with NA in the trainingLoad_lag column indicating that no session occurred the day prior.

Fix #2: Use the week() function from the lubridate package and have R automatically find the week of the year corresponding to the date of the training session.

date <- c(seq(as.Date("2020/01/05"), as.Date("2020/01/08"), by = "days"),
          seq(as.Date("2020/01/11"), as.Date("2020/01/14"), by = "days"))
trainingLoad <- round(rnorm(n = length(date), mean = 460, sd = 60), 0)
soreness <- round(runif(n = length(date), min = 3, max = 6), 0)
df <- data.frame(date, trainingLoad, soreness)
df


# Add in the week
df <- df %>%
  mutate(trainingWeek = week(date))

# Group by trainingWeek

df %>%
  group_by(trainingWeek) %>%
  mutate(trainingLoad_lag = lag(trainingLoad))

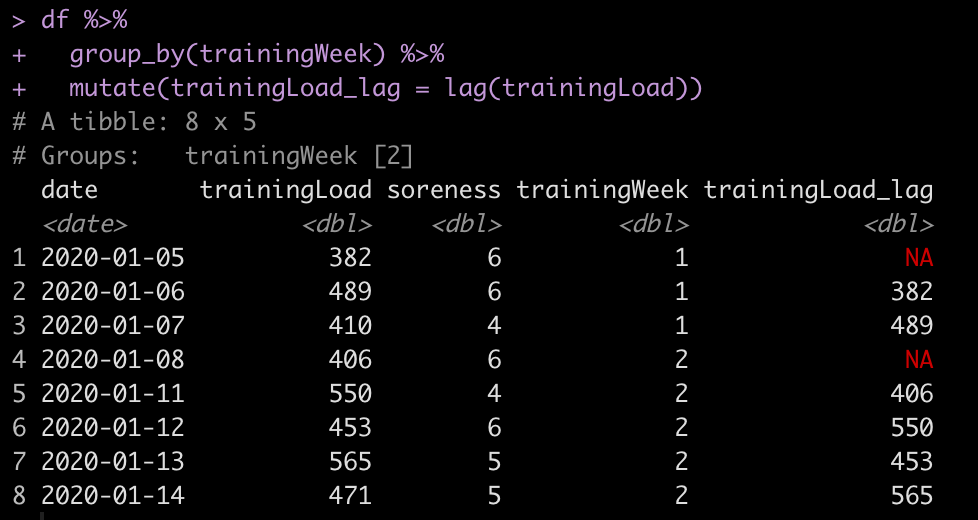
Running all of the above code we find that the week() function identified the week of the year based on the date and then we were able to group_by() the training week variable to come to the same outcome as we did in Fix 1.

Example 3: Working Across Weeks with Multiple Athletes

athlete <- rep(LETTERS[1:3], each = 8)
mesocycle <- rep(rep(c(1, 2), each = 4), times = 3)
date <- rep(c(seq(as.Date("2020/01/05"), as.Date("2020/01/08"), by = "days"),
          seq(as.Date("2020/01/12"), as.Date("2020/01/15"), by = "days")), times = 3)
trainingLoad <- round(rnorm(n = length(date), mean = 460, sd = 60), 0)
soreness <- round(runif(n = length(date), min = 3, max = 6), 0)
df <- data.frame(athlete, mesocycle, date, trainingLoad, soreness) 
 
# Group by athlete and mesocycle 
df %>%
  group_by(athlete, mesocycle) %>%
  mutate(trainingLoad_lag = lag(trainingLoad)) %>%
  as.data.frame()

All we need to do is pass the group_by() function athlete and mesocycle and R will apply the lag() function to our training_load variable based on these parameters.

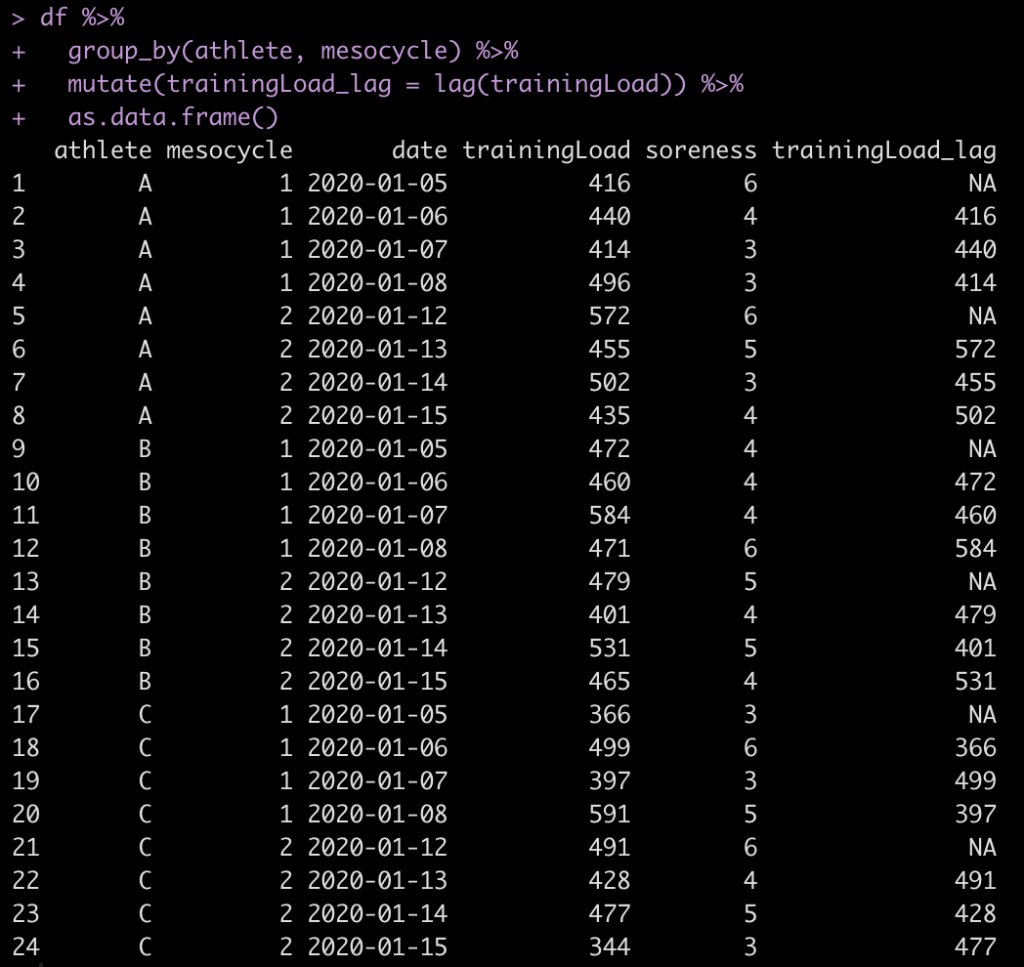
Notice that R correctly grouped by the 3 athletes and the 2 mesocycles (4 sessions per mesocycle) for each athlete. In doing so, we have an NA for the first day of each mesocycle for each athlete.

If you’d like the full code, CLICK HERE.

TidyX Episode 5: Animated Graphics

This week, Ellis Hughes and I go through a cool animation plot produced by Owen Churches on winning the Tour de France teams over time from data provided by the TidyTuesday Project.

After that, we apply the concept of animated graphics to create a markdown report using data on from the 2019 National Women’s Soccer League. The data comes form the nwslR package, which is a package created by Arielle Dror and Sophia Tannir and offers a variety of game and player specific data from the NWSL.

To watch this week’s screen cast, CLICK HERE.

For the the code to create the animated NWSL report, CLICK HERE.

If you’d like to see the final markdown report, CLICK HERE >> TidyX-Episode-5—Animated-Graphics

R Tips & Tricks: Joining Data Sets

I get a lot of questions from students and colleagues in Sports Science regarding how to do various tasks in R. Most are coming from a strong background in Excel so delving into a language like R can have a steep learning curve. As such, I decided to put together this series called R Tips & Tricks to share some of the different tasks you might already be doing in excel that you can do in R.

Today, I’ll discuss joining different data sets. Excel users would commonly do this with VLOOKUP or some type of INDEX. In R, we will use the series of join functions that can be found in the dplyr package.

First, we load the tidyverse package, which contains a suite of packages (dplyr, ggplot2, purrr, and others) useful for data manipulation, data cleaning, and data visualization. Those interested in some of the capabilities of tidyverse should check out the TidyX Screencast series myself and Ellis Hughes have been doing.

In addition to loading tidyverse we will also simulate two data sets.


## Load tidyverse

library(tidyverse)

## Make two data frames

trainingData <- data.frame(
  Name = c(rep(c("Bob", "Mike", "Jeff"), each = 4), rep("James", each = 3)),
  Day = c(rep(1:4, times = 3), 1:3),
  trainignLoad = round(rnorm(n = 15, mean = 400, sd = 150), 0))

wellnessData <- data.frame(
  Name = c(rep(c("Bob", "Mike", "Jeff"), each = 2), rep("James", each = 4)),
  Day = c(rep(1:2, times = 3), 1:4),
  wellness = round(rnorm(n = 10, mean = 6, sd = 1), 0))


Here is what the two data sets look like:

These data sets represent a common issue in sports science, where you might have training data (e.g., GPS data) on one computer and wellness questionnaire data on another. The goal is to bring them together in a centralized way so that you can do further analysis, build reports, or build visualizations.

We will detail five of the main join functions you can use for this task, depending on your needs:

1) left_join()
2) right_join()
3) inner_join()
4) anti_join()
4) full_join()

left_join()

left_join() looks for all of the matches between the left and right data frames and retains all of the rows in the left data frame, putting NA in any row where there is not a match in the right data frame.

Let’s join the trainingData (left data frame) to the wellnessData (right data frame) on the columns “Name” and “Day”.


trainingData %>%
  left_join(wellnessData, by = c("Name", "Day")) %>%
  as.data.frame()

After running this code, we see that we retain all 15 rows in the trainingData and in instances where an athlete may have forgot to put in the wellness data (e.g., Day 3 and 4 for Bob) R gives us an NA.

right_join()

right_join(), as you would imagine, behaves in the opposite way as left_join(). Here, right_join() looks for all of the matches between the right and left data frames and retains all of the rows in the right data frame, putting NA in any row where there is not a match in the left data frame.

Let’s join the training load data to the wellness data using right_join().

trainingData %>%
  right_join(wellnessData, by = c("Name", "Day")) %>%
  as.data.frame()

The data frame that gets returned after running that code has gotten smaller because we are only retaining rows from the right data frame (wellness) that were the same in the left data frame (training) based on our join criteria (Name and Day).

inner_join()

inner_join() only retains the complete matches between the left and right data frames and discards all other rows.

trainingData %>%
  inner_join(wellnessData, by = c("Name", "Day")) %>%
  as.data.frame()

Running this code returns only the 9 matching rows based on our join criteria (Name and Day).

anti_join()

As the name would imply, anti_join() only returns the rows where there are NO matches between the left and right data frames based on the join criteria (Name and Day) and discards the rest.

trainingData %>%
  anti_join(wellnessData, by = c("Name", "Day")) %>%
  as.data.frame()

After running the code we are returned the 6 rows that were unmatched between the two data sets. There are a few instances where this type of join is useful. One use case was detailed in our TidyX 4 screen cast, where we did some text analysis.

full_join()

Finally, the full_join() will join all rows in the left data frame with all rows in the right data frame and it will put NA in columns for any rows that don’t have a match.

trainingData %>%
  full_join(wellnessData, by = c("Name", "Day")) %>%
  as.data.frame()

Here we see that we are returned all 15 rows of the largest data frame and there are NA place holders anywhere that data was empty when joining on the specified join criteria (Name and Day).

All code is available at my GITHUB page.

TidyX Episode 4: patchwork & Interactive Graphics

In Episode 4, Ellis Hughes and I go over R code from Dr. Maggie Sorgin, who used data on beer production, provided by the TidyTuesday Project, to create a nice plot of multiple data visualizations using the patchwork package.

In this episode we touch on:

  • The patchwork R package, which allows us you to combine several plots on one page.
  • How to create interactive visualizations using the plotly package.
  • Finally, using an NBA data set, we go over how to pull together all of your graphics into a single report using R Markdown, allowing you to produce an URL with interactive graphics.

To watch the screen cast, CLICK HERE.

To get the code for producing the report, CLICK HERE.

To see the interactive report, CLICK HERE >> TidyX-Episode-4—patchwork—Interactive-Graphics