I was recently asked by a colleague for a simple solution to produce a multipage PDF for a training load report. The colleague wanted the report to generate a new page for each position group.
There are a few ways to solve this problem with loops, but below is literally the easiest approach you can take.
First, we will load in two packages that we need, {tidyverse}, for data manipulation and visualization, and {patchwork}, for organizing multiple plots on a page. Additionally, I’ll create a z-score function so that we can standardize the training load variables for each individual (In my opinion, it makes these types of charts look nicer when the data is on the same scale since athletes within the same position group can sometimes have very different training responses).
## load packages and custom z-score function
library(tidyverse)
library(patchwork)

z_score <- function(x){
  z = (x - mean(x, na.rm = T)) / sd(x, na.rm = T)
  return(z)
}
Next, we will just simulate some fake training data.
## simulate data
athlete <- rep(LETTERS[1:10], each = 10)
pos <- rep(c("DB", "LB", "DL", "OL", "WR"), each = 20)
week <- rep(1:10, times = 10)
Total_Dist <- round(rnorm(n = length(athlete), mean = 3200, sd = 400), 0)
HSR <- round(rnorm(n = length(athlete), mean = 450, sd = 100), 0)

df <- data.frame(athlete, pos, week, Total_Dist, HSR) df %>% head()

Let’s go ahead and apply our z-score function to our two training variables, Total Distance (Total_Dist) and High Speed Running (HSR). Notice that I group by “athlete” to ensure that the mean and standard deviation used to normalize each variable is specific to the individual and not the entire population.
df <- df %>%
  group_by(athlete) %>%
  mutate(TD_z = z_score(Total_Dist),
         HSR_z = z_score(HSR))
Now we need to make a function that will create the plots we want. The code below can look a little intimidating, so here are a few points to help you wrap your head around it:
- It is literally just two {ggplot2} plots. All I did was store each one in their own object (so that we could pair them together with {patchwork} and wrap them inside of this function).
- The easiest way to get used to doing this is to write your {ggplot2} plots out as you normally would (as if you were creating them for a single position group). When you have the plot built to your specifications then just wrap it into a function. The argument for the function should take the value that you want to iterate over. In this case, we want to create plots for each position group, so I call the argument “POS”, short for position. When I run that function I provide the “POS” argument with the abbreviation for the position group I am interested in and the function will do the rest. The function works in this manner because you’ll notice that the second line of each of the plots is a filter that is specifically pulling out the position group of interest from the original data set.
- The final line of the function creates an element called “plots”. You’ll see that the element consists of the two plots that we created above it and they are separated by a “|”. This vertical bar is just telling the {patchwork} package to place one plot right next to the other.
### Build a function for the plots to loop over position group

plt_function <- function(POS){

  dist_plt <- df %>%
    filter(pos == POS) %>%
    ggplot(aes(x = as.factor(week), y = TD_z, group = 1)) +
    geom_hline(yintercept = 0) +
    geom_line(size = 1) +
    geom_area(fill = "light green",
              alpha = 0.7) +
    facet_wrap(~athlete) +
    theme_bw() +
    theme(axis.text.x = element_text(size = 9, face = "bold"),
          axis.text.y = element_text(size = 9, face = "bold"),
          strip.background = element_rect(fill = "black"),
          strip.text = element_text(color = "white", face = "bold", size = 8)) +
    labs(x = "",
         y = "Total Distance",
         title = "Weekly Training Distance",
         subtitle = paste("Position", POS, sep = " = ")) +
    ylim(c(-3.5, 3.5))

  hsr_plt <- df %>%
    filter(pos == POS) %>%
    ggplot(aes(x = as.factor(week), y = HSR_z, group = 1)) +
    geom_hline(yintercept = 0) +
    geom_line(size = 1) +
    geom_area(fill = "light green",
              alpha = 0.7) +
    facet_wrap(~athlete) +
    theme_bw() +
    theme(axis.text.x = element_text(size = 9, face = "bold"),
          axis.text.y = element_text(size = 9, face = "bold"),
          strip.background = element_rect(fill = "black"),
          strip.text = element_text(color = "white", face = "bold", size = 8)) +
    labs(x = "",
         y = "HSR",
         title = "Weekly HSR",
         subtitle = paste("Position", POS, sep = " = ")) +
    ylim(c(-3.5, 3.5))


  plots <- dist_plt | hsr_plt
  plots

}
Let’s try out the function on just one group. We will pass the POS argument the abbreviation “DB”, for the defensive backs group.
# try out the function

plt_function(POS = "DB")

It worked!!
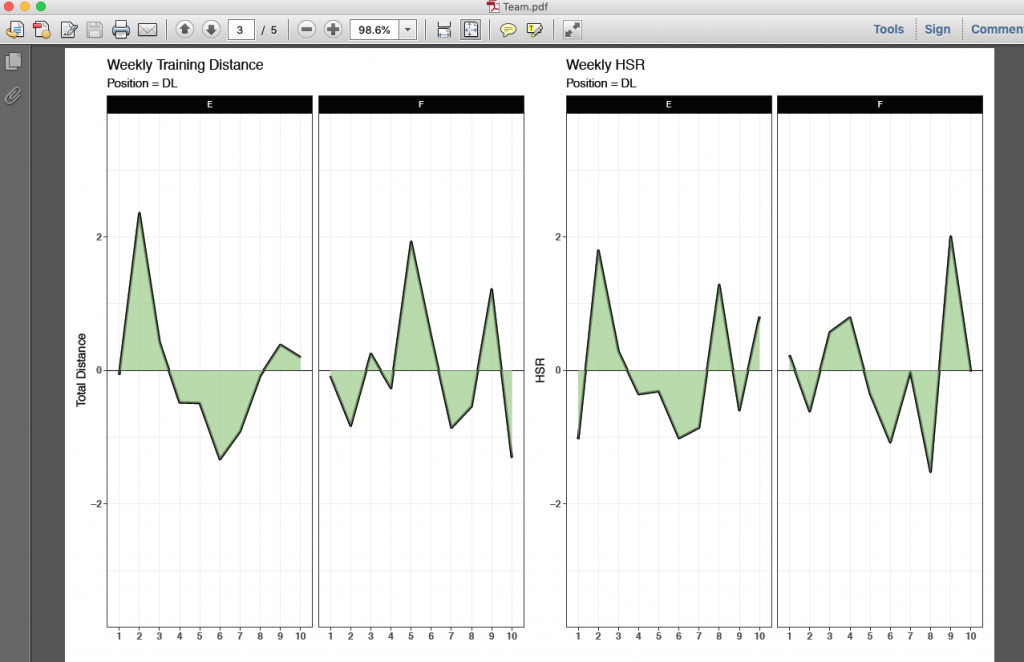
Okay, now let’s create our multipage PDF report. To do this, all we need to do is run the above line of code for each of our position groups. To ensure that we get each position plot into the PDF, we begin the code chunk with the pdf() function. It is here that we will specify the width and height of the plot page within the PDF itself (NOTE: you many need to play around with this depending on what your plots look like). We can also name the PDF report. Here I just called it “Team.pdf”. Finally, after running the line of code for each position group plot, we run the function dev.off(), which just shuts down the specified PDF device so that R knows that we are done making plots.
## create a multipage pdf with each page representing a position group

pdf(width = 12, height = 8, "Team.pdf")
plt_function(POS = "DB")
plt_function(POS = "LB")
plt_function(POS = "DL")
plt_function(POS = "OL")
plt_function(POS = "WR")
dev.off()
And that’s it! We end up with a 5 page PDF that has a different position group on each page.
If you want to see the finished product, click here: Team
The full code is on my github page. CLICK HERE


