Author Archives: Patrick

Regression to the Mean in Sports

Last week, scientist David Borg posted an article to twitter talking about regression to the mean in epidemiological research (1). Regression to the Mean is a statistical phenomenon where extreme observations tend to move closer towards the population mean in subsequent observations, due simply to natural variation. To steal Galton’s example, tall parents will often have tall children but those children, while taller than the average child, will tend to be shorter than their parents (regressed to the mean). It’s also one of the reasons why clinicians have such a difficult time understanding whether their intervention actually made the patient better or whether observed improvements are simply due to regression to the mean over the course of treatment (something that well designed studies attempt to rule out by using randomized controlled experiments).

Of course, this phenomenon is not unique to epidemiology or biostatistics. In fact, the phrase is commonly used in sport when discussing players or teams that have extremely high or low performances in a season and there is a general expectation that they will be more normal next year. An example of this could be the sophomore slump exhibited by rookies who perform at an extremely high level in their first season.

Given that this phenomenon is so common in our lives, the goal with this blog article is to show what regression to the mean looks like for team wins in baseball from one year to the next.

Data

We will use data from the Lahman baseball database (freely available in R) and concentrate on team wins in the 2015 and 2016 MLB seasons.

library(tidyverse)
library(Lahman)
library(ggalt)

theme_set(theme_bw())

data(Teams)

dat <- Teams %>%
  select(yearID, teamID, W) %>%
  arrange(teamID, yearID) %>%
  filter(yearID %in% c(2015, 2016)) %>%
  group_by(teamID) %>%
  mutate(yr_2 = lead(W)) %>%
  rename(yr_1 = W) %>%
  filter(!is.na(yr_2)) %>%
  ungroup() 

dat %>%
  head()


Exploratory Data Analysis

dat %>%
  ggplot(aes(x = yr_1, y = yr_2, label = teamID)) +
  geom_point() +
  ggrepel::geom_text_repel() +
  geom_abline(intercept = 0,
              slope = 1,
              color = "red",
              linetype = "dashed",
              size = 1.1) +
  labs(x = "2015 wins",
       y = "2016 wins")

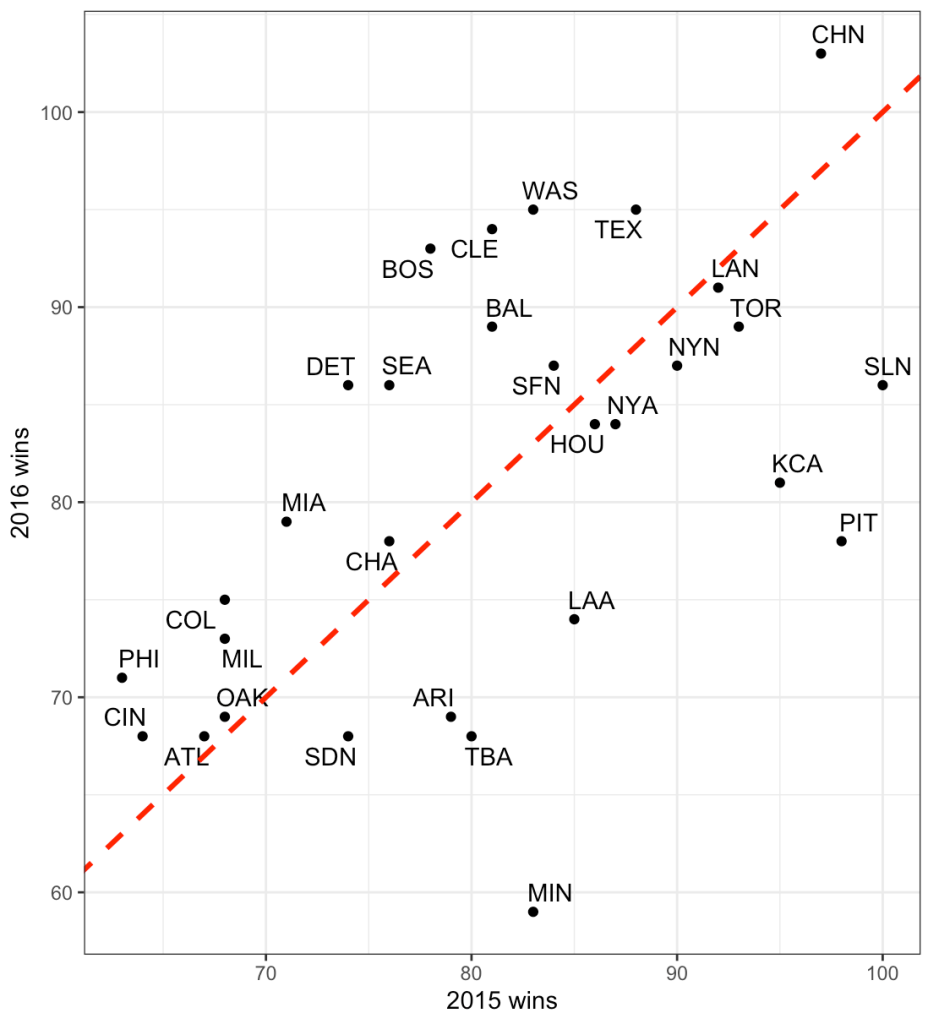
The dashed line is the line of equality. A team that lies exactly on this line would be a team that had the exact number of wins in 2015 as they did in 2016. While no team lies exactly on this line, looking at the chart, what we can deduce is that teams below the red line had more wins in 2015 and less in 2016 while the opposite is true for those that lie above the line. Minnesota had a large decline in performance going from just over 80 wins in 2015 to below 60 wins in 2017.

The correlation between wins in 2015 to wins in 2016 is 0.54.

cor.test(dat$yr_1, dat$yr_2)

Plotting changes in wins from 2015 to 2016

We can plot each team and show their change in wins from 2015 (green) to 2016 (blue). We will break them into two groups, teams that saw a decrease in wins in 2016 relative to 2015 and teams that saw an increase in wins from 2015 to 2016. We will plot the z-score of team wins on the x-axis so that we can reflect average as being “0”.

## get the z-score of team wins for each season
dat <- dat %>%
  mutate(z_yr1 = (yr_1 - mean(yr_1)) / sd(yr_1),
         z_yr2 = (yr_2 - mean(yr_2)) / sd(yr_2))

dat %>%
  mutate(pred_z_dir = ifelse(yr_2 > yr_1, "increase wins", "decrease wins")) %>%
  ggplot(aes(x = z_yr1, xend = z_yr2, y = reorder(teamID, z_yr1))) +
  geom_vline(xintercept = 0,
             linetype = "dashed",
             size = 1.2,
             color = "grey") +
  geom_dumbbell(size = 1.2,
                colour_x = "green",
                colour_xend = "blue",
                size_x = 6,
                size_xend = 6) +
  facet_wrap(~pred_z_dir, scales = "free_y") +
  scale_color_manual(values = c("decrease wins" = "red", "increase wins" = "black")) +
  labs(x = "2015",
       y = "2016",
       title = "Green = 2015 Wins\nBlue = 2016 Wins",
       color = "Predicted Win Direction")

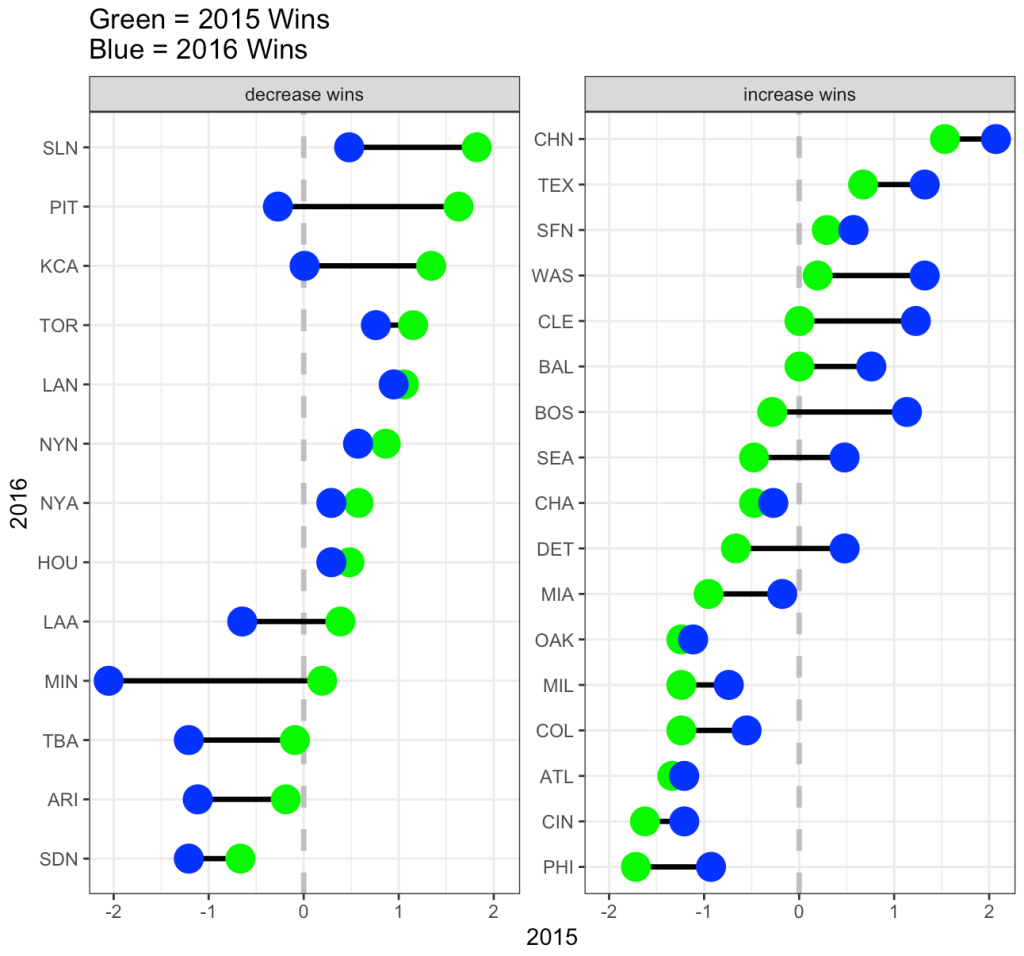
On the decreasing wins side, notice that all teams from SLN to LAA had more wins in 2015 (green) and then regressed towards the mean (or slightly below the mean) in 2016. From MIN down, those teams actually got even worse in 2016.

On the increasing wins side, from BOS down to PHI all of the teams regressed upward towards the mean (NOTE: regressing upward sounds weird, which is why some refer to this as reversion to the mean). From CHN to BAL, those teams were at or above average in 2015 and got better in 2016.

It makes sense that not all teams revert towards the mean in the second year given that teams attempt to upgrade their roster from one season to the next in order to maximize their chances of winning more games.

Regression to the with linear regression

There are three ways we can evaluate regression to the mean using linear regression and all three approaches will lead us to the same conclusion.

1. Linear regression with the raw data, predicting 2016 wins from 2015 wins.

2. Linear regression predicting 2016 wins from the grand mean centered 2015 wins (grand mean centered just means subtracting the league average wins, 81, from the observed wins for each team).

3. Linear regression using z-scores. This approach will produce results in standard deviation units rather than raw values.

## linear regression with raw values
fit <- lm(yr_2 ~ yr_1, data = dat)
summary(fit)

## linear regression with grand mean centered 2015 wins 
fit_grand_mean <- lm(yr_2 ~ I(yr_1 - mean(yr_1)), data = dat)
summary(fit_grand_mean)

## linear regression with z-score values
fit_z <- lm(z_yr2 ~ z_yr1, data = dat)
summary(fit_z)

Next, we take these equations and simply make predictions for 2016 win totals for each team.

dat$pred_fit <- fitted(fit)
dat$pred_fit_grand_mean <- fitted(fit_grand_mean)
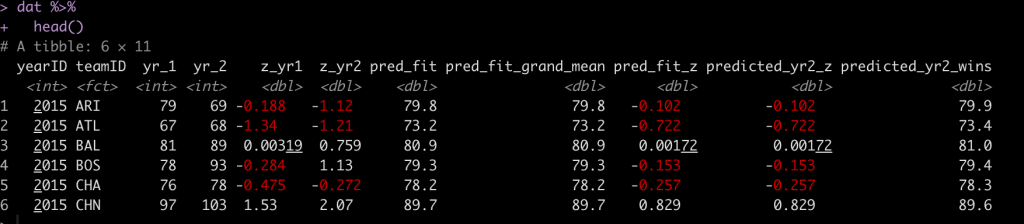
dat$pred_fit_z <- fitted(fit_z) dat %>%
  head()

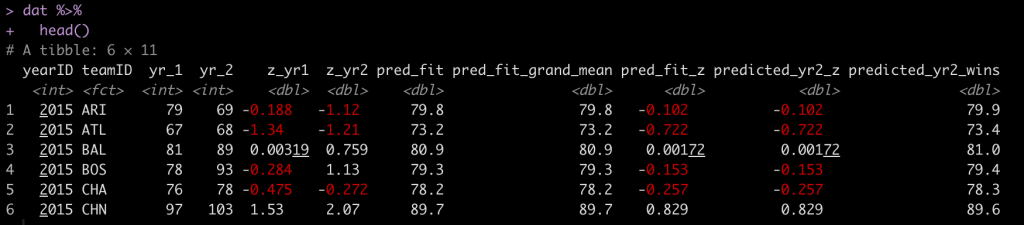
You’ll notice that the first two predictions are exactly the same. The third prediction is in standard deviation units. For example, Arizona (ARI) was -0.188 standard deviations below the mean in 2015 and in 2016 they were predicted to regress towards the mean and be -0.102 standard deviations below the mean. However, they actually went the other way and got even worse, finishing the season -1.12 standard deviations below the mean!

We can plot the residuals and see how off our projections where for each team’s 2016 win total.

par(mfrow = c(2,2))
hist(resid(fit), main = "Linear reg with raw values")
hist(resid(fit_grand_mean), main = "Linear reg with\ngrand mean centered values")
hist(resid(fit_z), main = "Linear reg with z-scored values")

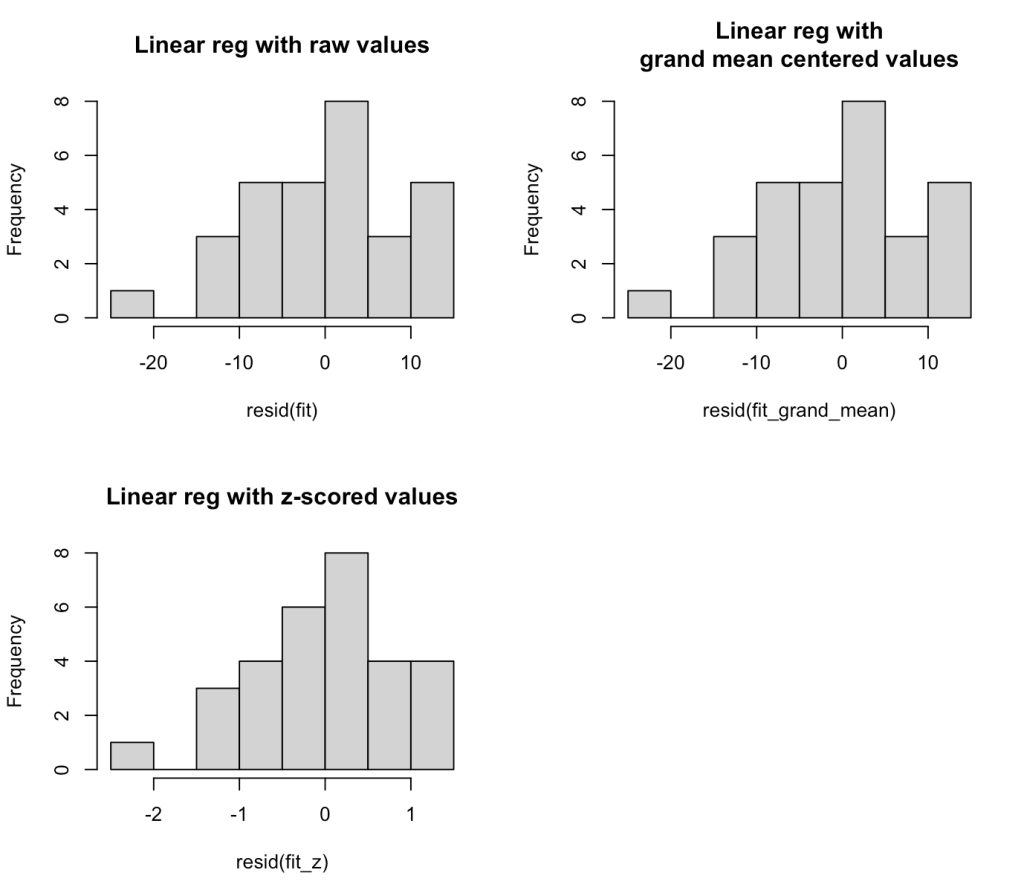
The residuals look weird here because we are only dealing with two seasons of data. At the end of this blog article I will run the residual plot for all seasons from 2000 – 2019 to show how the residuals resemble more of a normal distribution.

We can see that there seems to be an extreme outlier that has a -20 win residual. Let’s pull that team out and see who it was.

dat %>%
  filter((yr_2 - pred_fit) < -19)

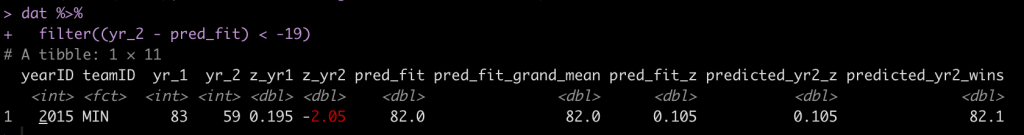
It was Minnesota, who went from an average season in 2015 (83 wins) and dropped all the way to 59 wins in 2016 (-2.05 standard deviations below the mean), something we couldn’t have really predicted.

The average absolute change from year1 to year2 for these teams was 8 wins.

mean(abs(dat$yr_2 - dat$yr_1))

Calculating Regression to the mean by hand

To explore the concept more, we can calculate regression toward the mean for the 2016 season by using the year-to-year correlation of team wins, the average wins for the league, and the z-score for each teams wins in 2015. The equation looks like this:

yr2.wins = avg.league.wins + sd_wins * predicted_yr2_z

Where predicted_yr2_z is calculated as:

predicted_yr2_z = (yr_1z * year.to.year.correlation)

We calculated the correlation coefficient above but let’s now store it as its own variable. Additionally we will store the league average team wins and standard deviation in 2015.

avg_wins <- mean(dat$yr_1)
sd_wins <- sd(dat$yr_1)
r <- cor.test(dat$yr_1, dat$yr_2)$estimate

avg_wins
sd_wins
r

On average teams won 81 games (which makes sense for a 162 season) with a standard deviation of about 10 games.

Let’s look at Pittsburgh (Pitt)

dat %>%
  filter(teamID == "PIT") %>%
  select(yearID:z_yr1) %>%
  mutate(predicted_yr2_z = z_yr1 * r,
         predicted_yr2_wins = avg_wins + sd_wins * predicted_yr2_z)

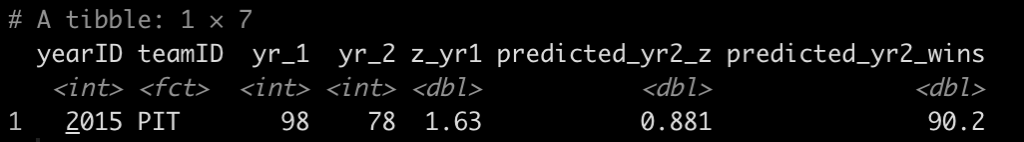
  • In 2015 Pittsburgh had 98 wins, a z-score of 1.63.
  • We predict them in 2016 to regress to the mean and have a z-score of 0.881 (90 wins)

Add these by hand regression to the mean predictions to all teams.

dat <- dat %>%
  mutate(predicted_yr2_z = z_yr1 * r,
         predicted_yr2_wins = avg_wins + sd_wins * predicted_yr2_z)

dat %>%
  head()


We see that our by hand calculation produces the same prediction, as it should.

Show the residuals for all seasons from 2000 – 2019

Here, we will filter out the data from the data base for the desired seasons, refit the model, and plot the residuals.


dat2 <- Teams %>%
  select(yearID, teamID, W) %>%
  arrange(teamID, yearID) %>%
  filter(between(x = yearID,
                 left = 2000,
                 right = 2019)) %>%
  group_by(teamID) %>%
  mutate(yr_2 = lead(W)) %>%
  rename(yr_1 = W) %>%
  filter(!is.na(yr_2)) %>%
  ungroup() 

## Correlation between year 1 and year 2
cor.test(dat2$yr_1, dat2$yr_2)


## linear model
fit2 <- lm(yr_2 ~ yr_1, data = dat2)
summary(fit2)

## residual plot
hist(resid(fit2),
     main = "Residuals\n(Seasons 2000 - 2019")

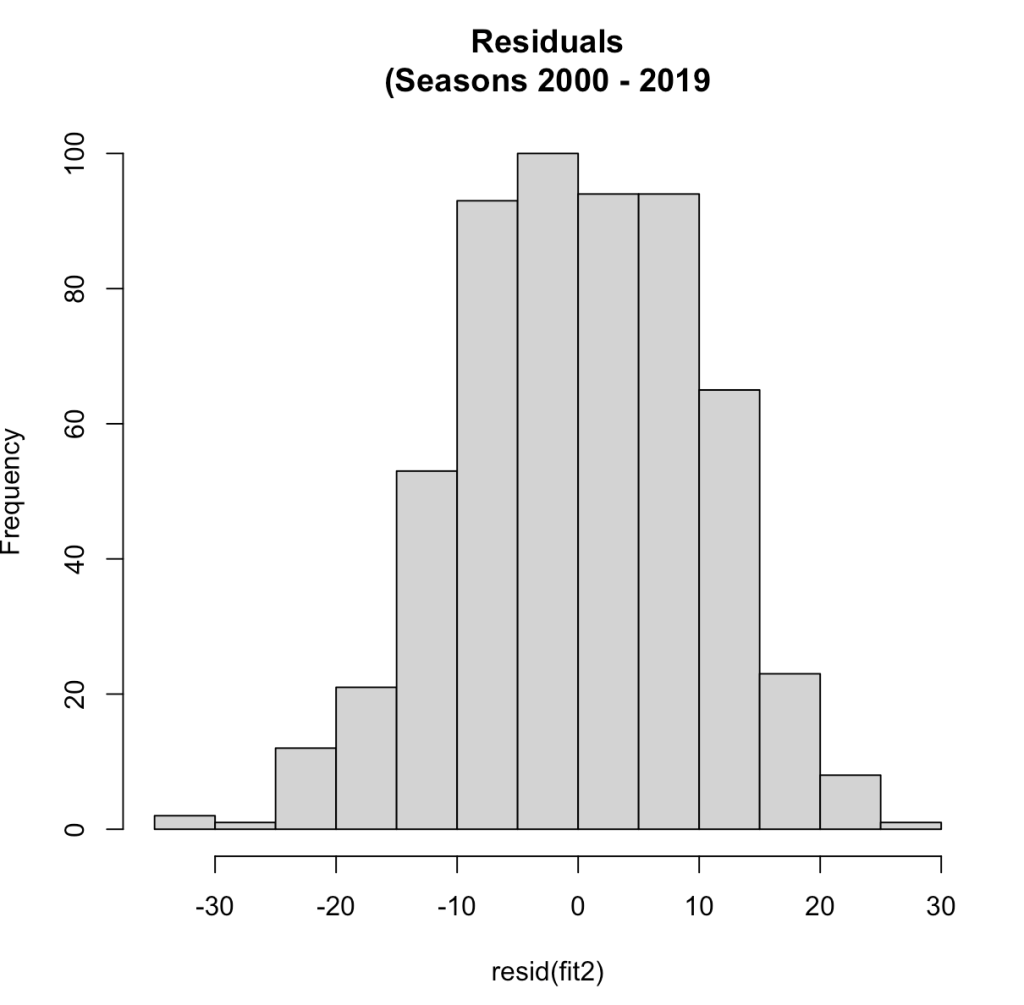
Now that we have more than a two seasons of data we see a normal distribution of the residuals. The correlation between year1 and year2 in this larger data set was 0.54, the same correlation we saw with the two seasons data.

With this larger data set, the average change in wins from year1 to year2 was 9 (not far from what we saw in the smaller data set above).

mean(abs(dat2$yr_2 - dat2$yr_1))

Wrapping Up

Regression to the mean is a common phenomenon in life. It can be difficult for practitioners in sports medicine and strength and conditioning to tease out the effects of regression to the mean when applying a specific training/rehab intervention. Often, regression to the mean fools us into believing that the intervention we did apply has some sort of causal relationship with the observed outcome. This phenomenon is also prevalent in sport when evaluating the performance of individual players and teams from one year to the next. With some simple calculations we can explore what regression to the mean could look like for data in our own setting, providing a compass and some base rates for us to evaluate observations going forward.

All of the code for this blog can be accessed on my GitHub page. If you notice any errors, please reach out!

References

1) Barnett, AG. van der Pols, JC. Dobson, AJ. (2005). Regression to the mean: what it is and how to deal with it. International Journal of Epidemiology; 34: 215-220.

2) Schall, T. Smith, G. Do baseball players regress toward the mean? The American Statistician; 54(4): 231-235.

TidyX Episode 112: s3 objects part 3 – building a sports tournament simulation

After a few weeks break, Ellis Hughes and I are back with our third and final installment of s3 objects (Part 1, Part 2). In this episode we complete our sports tournament simulation function and show it can be used to predict each successive round and move the winners across each match until an eventual winner is crowned.

To watch our screen cast, CLICK HERE.

To access our code, CLICK HERE.

tidymodels – Extract model coefficients for all cross validated folds

As I’ve discussed previously, we sometimes don’t have enough data where doing a train/test split makes sense. As such, we are better off building our model using cross-validation. In previous blog articles, I’ve talked about how to build models using cross-validation within the {tidymodels} framework (see HERE and HERE). In my prior examples, we fit the model over the cross-validation folds and then constructed the final model that we could then use to make predictions with, later on.

Recently, I ran into a situation where I wanted to see what the model coefficients look like across all of the cross-validation folds. So, I decided to make a quick blog post on how to do this, in case it is useful to others.

Load Packages & Data

We will use the {mtcars} package from R and build a regression model, using several independent variables, to predict miles per gallon (mpg).

### Packages -------------------------------------------------------

library(tidyverse)
library(tidymodels)

### Data -------------------------------------------------------

dat <- mtcars dat %>%
  head()


Create Cross-Validation Folds of the Data

I’ll use 10-fold cross validation.

### Modelling -------------------------------------------------------
## Create 10 Cross Validation Folds

set.seed(1)
cv_folds <- vfold_cv(dat, v = 10)
cv_folds

Specify a linear model and set up the model formula

## Specify the linear regression engine
## model specs
lm_spec <- linear_reg() %>%
  set_engine("lm") 


## Model formula
mpg_formula <- mpg ~ cyl + disp + wt + drat

Set up the model workflow  and fit the model to the cross-validated folds

## Set up workflow
lm_wf <- workflow() %>%
  add_formula(mpg_formula) %>%
  add_model(lm_spec) 

## Fit the model to the cross validation folds
lm_fit <- lm_wf %>%
  fit_resamples(
    resamples = cv_folds,
    control = control_resamples(extract = extract_model, save_pred = TRUE)
  )

Extract the model coefficients for each of the 10 folds (this is the fun part!)

Looking at the lm_fit output above, we see that it is a tibble consisting of various nested lists. The id column indicates which cross-validation fold the lists in each row pertain to. The model coefficients for each fold are stored in the .extracts column of lists. Instead of printing out all 10, let’s just have a look at the first 3 folds to see what they look like.

lm_fit$.extracts %>% 
  .[1:3]

There we see in the .extracts column, <lm> indicating the linear model for each fold. With a series of unnesting we can snag the model coefficients and then put them into a tidy format using the {broom} package. I’ve commented out each line of code below so that you know exactly what is happening.

# Let's unnest this and get the coefficients out
model_coefs <- lm_fit %>% 
  select(id, .extracts) %>%                    # get the id and .extracts columns
  unnest(cols = .extracts) %>%                 # unnest .extracts, which produces the model in a list
  mutate(coefs = map(.extracts, tidy)) %>%     # use map() to apply the tidy function and get the coefficients in their own column
  unnest(coefs)                                # unnest the coefs column you just made to get the coefficients for each fold

model_coefs

Now that we have a table of estimates, we can plot the coefficient estimates and their 95% confidence intervals. The term column indicates each variable. We will remove the (Intercept) for plotting purposes.

Plot the Coefficients

## Plot the model coefficients and 2*SE across all folds
model_coefs %>%
  filter(term != "(Intercept)") %>%
  select(id, term, estimate, std.error) %>%
  group_by(term) %>%
  mutate(avg_estimate = mean(estimate)) %>%
  ggplot(aes(x = id, y = estimate)) +
  geom_hline(aes(yintercept = avg_estimate),
             size = 1.2,
             linetype = "dashed") +
  geom_point(size = 4) +
  geom_errorbar(aes(ymin = estimate - 2*std.error, ymax = estimate + 2*std.error),
                width = 0.1,
                size = 1.2) +
  facet_wrap(~term, scales = "free_y") +
  labs(x = "CV Folds",
       y = "Estimate ± 95% CI",
       title = "Regression Coefficients ± 95% CI for 10-fold CV",
       subtitle = "Dashed Line = Average Coefficient Estimate over 10 CV Folds per Independent Variable") +
  theme_classic() +
  theme(strip.background = element_rect(fill = "black"),
        strip.text = element_text(face = "bold", size = 12, color = "white"),
        axis.title = element_text(size = 14, face = "bold"),
        axis.text.x = element_text(angle = 60, hjust = 1, face = "bold", size = 12),
        axis.text.y = element_text(face = "bold", size = 12),
        plot.title = element_text(size = 18),
        plot.subtitle = element_text(size = 16))

Now we can clearly see the model coefficients and confidence intervals for each of the 10 cross validated folds.

Wrapping Up

This was just a quick and easy way of fitting a model using cross-validation to extract out the model coefficients for each fold. Often, this is probably not necessary as you will fit your model, evaluate your model, and be off and running. However, there may be times where more specific interrogation of the model is required or, you might want to dig a little deeper into the various outputs of the cross-validated folds.

All of the code is available on my GitHub page.

If you notice any errors in code, please reach out!


TidyX Episode 111: Interview with Data Scientist Nate Latshaw

This week, Ellis Hughes and I have the pleasure of interview, Nate Latshaw. Nate is an extraordinary data scientist who does a ton of amazing public analysis on all of the UFC fights and shares his work freely on Twitter.

We start by having Nate take us through one of the UFC fighter plots he commonly presents. What’s exciting about this is that Nate uses some different R-packages that we haven’t touched on in the past 110 episodes. For instance, Nate tends to work more in {data.table} instead of {tidyverse} for all of his data manipulation needs. Additionally, to organize the figures and tables in his fighter report, he builds his tables in {ggtextable} and organizes everything with {ggpubr} into the report you see below. After Nate walks us through some code we have an interview talking about his background, how he got into data science, and his recommendations for how others can break into data science.

To watch the screen cast, CLICK HERE.

To access Nate’s code, CLICK HERE.

Optimization Algorithms in R – returning model fit metrics

Introduction

A colleague had asked me if I knew of a way to obtain model fit metrics, such as AIC or r-squared, from the optim() function. First, optim() provides a general-purpose method of optimizing an algorithm to identify the best weights for either minimizing or maximizing whatever success metric you are comparing your model to (e.g., sum of squared error, maximum likelihood, etc.). From there, it continues until the model coefficients are optimal for the data.

To make optim() work for us, we need to code the aspects of the model we are interested in optimizing (e.g., the regression coefficients) as well as code a function that calculates the output we are comparing the results to (e.g., sum of squared error).

Before we get to model fit metrics, let’s walk through how optim() works by comparing our results to a simple linear regression. I’ll admit, optim() can be a little hard to wrap your head around (at least for me, it was), but building up a simple example can help us understand the power of this function and how we can use it later on down the road in more complicated analysis.

Data

We will use data from the Lahman baseball data base. I’ll stick with all years from 2006 on and retain only players with a minimum of 250 at bats per season.

library(Lahman)
library(tidyverse)

data(Batting)

df <- Batting %>% 
  filter(yearID >= 2006,
         AB >= 250)

head(df)


Linear Regression

First, let’s just write a linear regression to predict HR from Hits, so that we have something to compare our optim() function against.

fit_lm <- lm(HR ~ H, data = df)
summary(fit_lm)

plot(df$H, df$HR, pch = 19, col = "light grey")
abline(fit_lm, col = "red", lwd = 2)

The above model is a simple linear regression model that fits a line of best fit based on the squared error of predictions to the actual values.

(NOTE: We can see from the plot that this relationship is not really linear, but it will be okay for our purposes of discussion here.)

We can also use an optimizer to solve this.

Optimizer

To write an optimizer, we need two functions:

  1.  A function that allow us to model the relationship between HR and H and identify the optimal coefficients for the intercept and the slope that will help us minimize the residual between the actual and predicted values.
  2.  A function that helps us keep track of the error between actual and predicted values as optim() runs through various iterations, attempting a number of possible coefficients for the slope and intercept.

Function 1: A linear function to predict HR from hits

hr_from_h <- function(H, a, b){
  return(a + b*H)
}

This simple function is just a linear equation and takes the values of our independent variable (H) and a value for the intercept (a) and slope (b). Although, we can plug in numbers and use the function right now, the values of a and b have not been optimized yet. Thus, the model will return a weird prediction for HR. Still, we can plug in some values to see how it works. For example, what if the person has 30 hits.

hr_from_h(H = 30, a = 1, b = 1)

Not a really good prediction of home runs!

Function 2: Sum of Squared Error Function

Optimizers will try and identify the key weights in the function by either maximizing or minimizing some value. Since we are using a linear model, it makes sense to try and minimize the sum of the squared error.

The function will take 3 inputs:

  1.  A data set of our dependent and independent variables
  2.  A value for our intercept (a)
  3.  A value for the slope of our model (b)
sum_sq_error <- function(df, a, b){
  
  # make predictions for HR
  predictions <- with(df, hr_from_h(H, a, b))
  
  # get model errors
  errors <- with(df, HR - predictions)
  
  # return the sum of squared errors
  return(sum(errors^2))
  
}


Let’s make a fake data set of a few values of H and HR and then assign some weights for a and b to see if the sum_sq_error() produces a single sum of squared error value.

fake_df <- data.frame(H = c(35, 40, 55), 
                        HR = c(4, 10, 12))

sum_sq_error(fake_df,
             a = 3, 
             b = 1)

It worked! Now let’s write an optimization function to try and find the ideal weights for a and b that minimize that sum of squared error. One way to do this is to create a large grid of values, write a for loop and let R plug along, trying each value, and then find the optimal values that minimize the sum of squared error. The issue with this is that if you have models with more independent variables, it will take really long. A more efficient way is to write an optimizer that can take care of this for us.

We will use the optim() function from base R.

The optim() function takes 2 inputs:

  1.  A numeric vector of starting points for the parameters you are trying to optimize. These can be any values.
  2.  A function that will receive the vector of starting points. This function will contain all of the parameters that we want to optimize. This function will take our sum_sq_error() function and it will get passed the starting values for a and b and then find their values that minimize the sum of squared error.
optimizer_results <- optim(par = c(0, 0),
                           fn = function(x){
                             sum_sq_error(df, x[1], x[2])
                             }
                           )

Let’s have a look at the results.

In the output:

  • value tells us the sum of the squared error
  • par tells us the weighting for a (intercept) and b (slope)
  • counts tells us how many times the optimizer ran the function. The gradient is NA here because we didn’t specify a gradient argument in our optimizer
  • convergence tells us if the optimizer found the optimal values (when it goes to 0, that means everything worked out)
  • message is any message that R needs to inform us about when running the optimizer

Let’s focus on par and value since those are the two values we really want to know about.

First, notice how the values for a and b are nearly the exact same values we got from our linear regression.

a_optim_weight <- optimizer_results$par[1]
b_optim_weight <- optimizer_results$par[2]

a_reg_coef <- fit_lm$coef[1]
b_reg_coef <- fit_lm$coef[2]

a_optim_weight
a_reg_coef

b_optim_weight
b_reg_coef

Next, we can see that the sum of squared error from the optimizer is the same as the sum of squared error from the linear regression.

sse_optim <- optimizer_results$value
sse_reg <- sum(fit_lm$residuals^2)

sse_optim
sse_reg

We can finish by plotting the two regression lines over the data and show that they produce the same fit.

plot(df$H, 
     df$HR,
     col = "light grey",
     pch = 19,
     xlab = "Hits",
     ylab = "Home Runs")
title(main = "Predicting Home Runs from Hits",
     sub = "Red Line = Regression | Black Dashed Line = Optimizer")
abline(fit_lm, col = "red", lwd = 5)
abline(a = a_optim_weight,
       b = b_optim_weight,
       lty = 2,
       lwd = 3,
       col = "black")

Model Fit Metrics

The value parameter from our optimizer output returned the sum of squared error. What if we wanted to return a model fit metric, such as AIC or r-squared, so that we can compare several models later on?

Instead of using the sum of squared errors function, we can attempt to minimize AIC by writing our own AIC function.

aic_func <- function(df, a, b){
  
  # make predictions for HR
  predictions <- with(df, hr_from_h(H, a, b))
  
  # get model errors
  errors <- with(df, HR - predictions)
  
  # calculate AIC
  aic <- nrow(df)*(log(2*pi)+1+log((sum(errors^2)/nrow(df)))) + ((length(c(a, b))+1)*2)
  return(aic)
  
}

We can try out the new function on the fake data set we created above.

aic_func(fake_df,
             a = 3, 
             b = 1)

Now, let’s run the optimizer with the AIC function instead of the sum of square error function.

optimizer_results <- optim(par = c(0, 0),
                           fn = function(x){
                             aic_func(df, x[1], x[2])
                             }
                           )

optimizer_results

We get the same coefficients with the difference being that the value parameter now returns AIC. We can check that this AIC compares to our original linear model.

AIC(fit_lm)

If we instead wanted to obtain an r-squared, we can write an r-squared function. In the optimizer, since a higher r-squared is better, we need to indicate that we are wanting to maximize this value (optim defaluts to minimization). To do this we set the fnscale argument to -1. The only issue I have with this function is that it doesn’t return the coefficients properly in the par section of the results. Not sure what is going on here but if anyone has any ideas, please reach out. I am able to produce the exact result of r-squared from the linear model, however.

## r-squared function
r_sq_func <- function(df, a, b){
  
  # make predictions for HR
  predictions <- with(df, hr_from_h(H, a, b))
  
  # r-squared between predicted and actual HR values
  r2 <- cor(predictions, df$HR)^2
  return(r2)
  
}

## run optimizer
optimizer_results <- optim(par = c(0.1, 0.1),
                           fn = function(x){
                             r_sq_func(df, x[1], x[2])
                             },
      control = list(fnscale = -1)
 )

## get results
optimizer_results

## Compare results to what was obtained from our linear regression
summary(fit_lm)$r.squared

Wrapping up

That was a short tutorial on writing an optimizer in R. There is a lot going on with these types of functions and they can get pretty complicated very quickly. I find that starting with a simple example and building from there is always useful. We additionally looked at having the optimizer return us various model fit metrics.

If you notice any errors in the code, please reach out!

Access to the full code is available on my GitHub page.