Author Archives: Patrick

Bayesian Linear Regression: Getting started with PyMC3

Previously I’ve used {rstanarm}, {brms}, and Stan for fitting Bayesian models. However, as I continue to work on improving my Python skills, I figured I’d try and delve into the PyMC3 framework for fitting such models. This article will go through the following steps:

  1. Fitting the model
  2. Making a point estimate prediction
  3. Making a point estimate prediction with uncertainty
  4. Calculating a posterior predictive distribution

I’ve covered the last three steps in a prior blog on making predictions with a Bayesian model. I know there are probably functions available in PyMC3 that can do these things automatically (just as there are in {rstanarm}) but instead of falling back on those, I create the posterior distributions here using numpy and build them myself.

The entire code and data are available on my GITHUB page, where I also have the model coded in {rstanarm}, for anyone interested in seeing the steps in a different code language.

Loading Libraries & Data

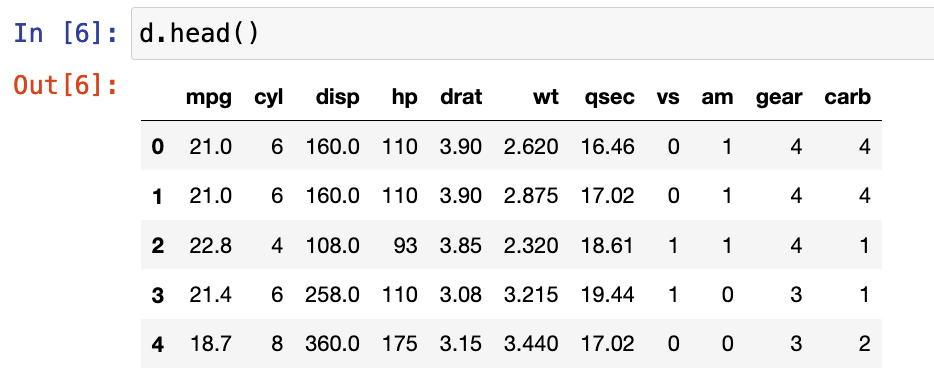
The data I’ll be using is the {mtcars} data set, which is available in R. I’ve saved a copy in .csv format so that I can load it into my Jupyter notebook.

import pandas as pd
import numpy as np
import matplotlib.pyplot as plt 
import seaborn as sns
import pymc3 as pm
import arviz as az 
import os

# load mtcars
d = pd.read_csv('mtcars.csv')
d.head()

Exploratory Data Analysis

The model will regress mpg on engine weight (wt). Let’s plot and describe those two variables so that we have a sense for what we might be working with.

Linear Regression

Before fitting the Bayesian model, I want to fit a simple regression model to see what the coefficients look like.

import statsmodels.api as sm

x = d['wt']
y = d['mpg']

x = sm.add_constant(x)

fit = sm.OLS(y, x).fit()

fit.summary()

We can see that for every one unit increase in engine weight the miles per gallon decrease, on average, by about 5.3.

Bayesian Regression (PyMC3)

Fitting a Bayesian regression model in PyMC3 requires us to specify some priors. For this model I’ll use a prior intercept of 40 ± 10 and a prior beta for the wt variable of 0 ± 10. The thing to note here is that the priors I’m specifying priors were created by first looking at the data that has been collected (which is technically cheating). Normally we would have priors BEFORE collecting our data (using prior published research, data from a pilot study, prior intuition, etc) and then combine the prior with the observations to obtain a posterior distribution. However, the aim here is to understand how to code the model, so I’ll use these priors. I’ll write a longer blog on priors and what they do to a model in the coming weeks.

Some notes on fitting the model in PyMC3:

  • The model is named ‘fit_b
  • We specify the intercept as variable ‘a
  • The beta coefficient for wt is called ‘b
  • Both the intercept and slope re fit with normally distributed priors
  • Finally, ‘e‘ represents the model error and it is fit with a a Half Cauchy prior
  • Once the priors are set, the model is specified (y_pred) as mu = a + b * wt + e
  • The trace_b object stores our posterior samples, 2000 of them of which the first 1000 will be discarded because they are there to allow the model to tune itself
, sd = e, observed = d['mpg'])
    
    trace_b = pm.sample(2000, tune = 1000)


Once the model has been fit we plot the trace plots to see how well it performed.

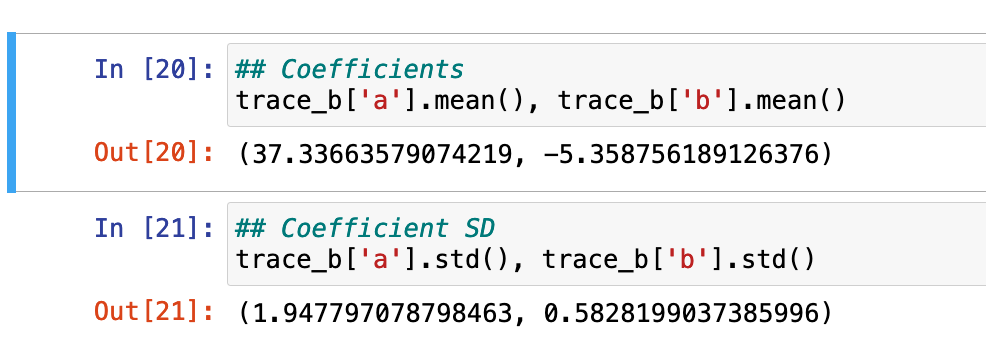
We can also directly call the mean and standard deviation values of our fitted model, which are relatively similar to what we saw with the linear regression model above.

Point Predictions

Next, we want to make a single point prediction for the mpg would expect, on average, when wt  is a specific value (in this example we will use wt = 3.3).

To do this, we simply store the average value of the posterior coefficients from our Bayesian regression and apply the specified model:

mu = a + b * new_wt

A car with an engine weight of 3.3 would get, on average, 19.7 mpg.

Point Prediction with Uncertainty

The point estimate is interesting (I guess), but there is uncertainty around that estimate as point predictions are never exact. We can compliment this point estimate by unveiling the uncertainty around it. The point prediction ± uncertainty interval informs us of the average value of  mpg along with the uncertainty of the coefficients in our model.

To do this, we create a random sample of 1000 values from the posterior distributions for our model intercept and beta coefficient. Each of these 1000 values represent a potential intercept and slope that would be consistent with our data, which shows us the uncertainty that we have in our estimates. When we use the model equation, multiplying each of these 1000 values by the new_wt value we obtain 1000 possible predicted values of mpg given a weight of 3.3.

With this posterior distribution we can then plot a histogram of the results and obtain summary statistics such as the mean, standard deviation, and 90% credible interval.

Posterior Predictive Distribution

Finally, instead of just knowing the average predicted value of mpg ± uncertainty for the population, we might be interested in knowing what the predicted value of mpg would be for a new car in the population with a wt of 3.3. For that, we calculate the posterior predictive distribution. The uncertainty in this predictive distribution will be larger than the point prediction with uncertainty because we are using the posterior model error added to our prediction.

First, similar to the model coefficients, we have to get the random draws of our error term, which we will call sigma.

Next, we run the model as we did in step 2 above; however, we also add to each of the 1000 posterior predictions the sigma value by taking a random draw from a normal distribution with a mean of 0 and standard deviation equal to the sigma sample values.

pred_dist = intercept_sample + beta_sample * new_wt_rep + np.random.normal(loc = 0, scale = sigma_sample, size = 1000)


Finally, we plot the distribution of our predicted values along with the mean, standard deviation, and 90% credible interval. Notice that these values are larger than what we obtained in step 2 because we are now taking into account additional uncertainty about the new wt observation.

Wrapping Up

That’s a brief intro to Bayesian regression with PyMC3. There are a lot more things that we can do with PyMC3 and it’s available functions. My goal is to put together more blog articles on Bayesian modeling with both R and Python so show their flexibility. If you spot any errors, please let me know.

The data and full code (along with a companion code in {rstanarm}) is available on my GITHUB page.

Loop function to save multiple plots as SVG files

I’ve discussed using loops for a number of statistical tasks (simulation, optimization, Gibbs sampling) as well as data processing tasks, such as writing data outputs to separate excel tabs within one excel file and creating a multiple page PDF with a plot on each page.

Today, I want to expand the loop function to produce separate SVG file plots and have R save those directly to a folder stored on my computer. The goal here is to have the separate plots in one place so that I can upload those files directly to a web app and allow them to be viewable for a decision-maker.

NOTE: You can save these files in other formats (e.g., jpeg, png). I chose SVG because it was the primary file type I had been working with.

Data

To keep the example simple, we will be using the {mtcars} data set, which is freely available in R. I’m going to set the cylinder (cyl) variable to be a factor as that is the variable that we will build our separate plot files for. In the sport setting, you can think of this as player names or player IDs, where you are building a plot for each individual, looping over them and producing a separate plot file.

library(tidyverse)
library(patchwork)

theme_set(theme_bw())

## data
dat <- mtcars %>%
  mutate(cyl = as.factor(cyl))


Example Plots

Here is an example of the three types of plots we will build. We will wrap the three plots together using the {patchwork} package. The below plot is using all of the data but our goal will be to produce a loop function that creates the same plot layout using data for each of the three cylinder types.

p1 <- dat %>%
  ggplot(aes(x = drat, y = hp)) +
  geom_point(size = 5) +
  geom_smooth(method = "lm",
              se = FALSE) +
  ggtitle("hp ~ drat")

p2 <- dat %>%
  count(carb) %>%
  mutate(carb = as.factor(carb)) %>%
  ggplot(aes(x = n, y = reorder(carb, n))) +
  geom_col() +
  labs(x = "Count",
       y = "Carb",
       title = "Carb Count")

p3 <- dat %>%
  ggplot(aes(x = wt)) +
  geom_histogram(fill = "light grey",
                 color = "black",
                 bins = 5) +
  ggtitle("Engine Weight")


(p2 | p3) / p1

Creating the loop for plotting

First, we create a function that produces the plots above. Basically, I’m taking the plotting code from above and wrapping it in a function. The function takes in input, i, and runs through the three plots for that input, at the end using the ggsave() function to save each plot to the dedicated file path.


# create a plot function for each cyl
plt_func <- function(i){
  p1 <- i %>%
    ggplot(aes(x = drat, y = hp)) +
    geom_point(size = 5) +
    geom_smooth(method = "lm",
                se = FALSE) +
    ggtitle("hp ~ drat")
  
  p2 <- i %>%
    count(carb) %>%
    mutate(carb = as.factor(carb)) %>%
    ggplot(aes(x = n, y = reorder(carb, n))) +
    geom_col() +
    labs(x = "Count",
         y = "Carb",
         title = "Carb Count")
  
  p3 <- i %>%
    ggplot(aes(x = wt)) +
    geom_histogram(fill = "light grey",
                   color = "black",
                   bins = 5) +
    ggtitle("Engine Weight")
  
  three_plt <- (p2 | p3) / p1
  
  
  ggsave(three_plt, file = paste0(unique(i$cyl), ".svg"))
}

Then, we use the split() function to split the data frame into a named list with each cylinder type being it’s own list that contains a data frame. The map() function then creates the loop over that list and for each element of the list (for each cylinder type) it runs our plot function above and saves the results. Notice that I’ve specified setwd() to indicate where I want the files to be saved to. If you are saving thousands of files at once and you don’t specify this and have your working directory defaulted to your desktop, it becomes a mess pretty quick (trust me!).

# setwd("name of the file path where you want to save the files goes here")
dat %>% 
  split(.$cyl) %>% 
  map(plt_func)

Once you’ve run the loop, your R output should look like this, where we see that each list element (cylinder) is being saved as an SVG file.

Our folder has the plot outputs:

If I click on any one of the SVG files I get the desired plot.

The above is for a 4 cylinder vehicle. Notice that I didn’t specify this at the top of the plot because my initial assumption was that I would be uploading the individual SVG files to a web application where there is a webpage dedicated to each cylinder type. Therefore, naming the plots by cylinder type would be redundant. However, if you want to add a plot to the {pathwork} layout about, you can use the plot_annotation() function.

(p2 | p3) / p1 + plot_annotation(title = "Engine cylinders")

We can add the plot_annotation() function to the loop but instead of a generic title, like above, we will need to create a bespoke title within the loop that stores each cylinder type. To do this, we use the paste() function to add the cylinder number in front of the word “cylinder” in our plot title name.

plt_func <- function(i){
  p1 <- i %>%
    ggplot(aes(x = drat, y = hp)) +
    geom_point(size = 5) +
    geom_smooth(method = "lm",
                se = FALSE) +
    ggtitle("hp ~ drat")
  
  p2 <- i %>%
    count(carb) %>%
    mutate(carb = as.factor(carb)) %>%
    ggplot(aes(x = n, y = reorder(carb, n))) +
    geom_col() +
    labs(x = "Count",
         y = "Carb",
         title = "Carb Count")
  
  p3 <- i %>%
    ggplot(aes(x = wt)) +
    geom_histogram(fill = "light grey",
                   color = "black",
                   bins = 5) +
    ggtitle("Engine Weight")
  
  cyl_name <- i %>% 
    select(cyl) %>%
    distinct(cyl) %>%
    pull(cyl)
  
  three_plt <- (p2 | p3) / p1 + plot_annotation(title = paste(cyl_name, "cylinder", sep = " ")) ggsave(three_plt, file = paste0(unique(i$cyl), ".svg")) } # setwd("name of the file path where you want to save the files goes here") dat %>% 
  split(.$cyl) %>% 
  map(plt_func)

Now we have plots with named titles.

Wrapping Up

During those times where you need to produce several individual plots, rather than doing them one-by-one, leverage R’s loop functions to rapidly produce multiple plots in one shot.

The full code is accessible on my GITHUB page.

TidyX Episode 132: Shiny app for fuzzy name joining

This week, Ellis Hughes and I revisit the fuzzy name joining function we wrote in Episode 127 and build it into a {shiny} app that allows users to upload a file of new data and a file of “gold standard” key names and then have the fuzzy name joining function run in the background and produce an output file of matched names.

To watch the screen cast, CLICK HERE.

To access our code, CLICK HERE.

Catapult GPS – Converting the practice duration string to minutes

One of the most frustrating things to deal with is date and time strings. Using Catapult GPS, a popular GPS provider for professional and collegiate sports teams, practice duration is reported in their export as a string, hours : minutes : seconds. Unfortunately, we can’t do much with this if we want to perform additional computations, for example calculate player load per minute, we need to convert this column into total minutes.

I’ve had a few people in the sports performance field reach out and ask how to do this in R because they often get frustrated and just resort to changing the data in their CSV download prior to importing it into R, where they then do their plotting and visualizing. Today, I’ll walk through a few steps using the {lubridate} package and show you how you can handle this data cleaning all within you R environment.

Load Packages & Get Data

We start by loading {tidyverse} and {lubridate} and some fake Catpault data that I’ve created.

### Packages ---------------------------------------
library(tidyverse)
library(lubridate)

### Load Data -------------------------------------
catapult <- read.csv("catapult_example.csv", header = TRUE) %>%
janitor::clean_names()

catapult

Adjusting time

We can see the duration string (hour : minute : second) indicating that the session was 97 minutes and 10 seconds long. Before handling the entire column of data, let’s just grab a single observation and work through the functions we need so that we know what is going on.

### Adjust Time ------------------------------------
# hms() function to split out duration to its component parts into a string
single_time <- catapult %>% 
  slice(1) %>% 
  pull(duration)

single_time

The hms() function can be used to convert each of the time components into a named string.

single_time2 <- hms(single_time)
single_time2

Once we have the individual components in a named string we can extract them out with the hour(), minute(), and second() functions and have each returned back as an integer.

# Select each component 
hour(single_time2)
minute(single_time2)
second(single_time2)

Once in integer form, converting this data to a total minutes value we first multiplying hour by 60 and divide second by 60 and then sum those up with minutes.

hour(single_time2)*60 + minute(single_time2) + second(single_time2)/60


The finished product suggests the session was 97.2 minutes long.

Applying the approach to all of our data

Now that we understand what is going on under the hood, we can apply this at scale, to our of our data.

catapult <- catapult %>%
  mutate(hour_min_sec = hms(duration),
    pract_time = hour(hour_min_sec) * 60 + minute(hour_min_sec) + second(hour_min_sec) / 60)

catapult

After getting practice time into minutes we will adjust the date column from a character string to an actual date, using the as.Date() function.

catapult$date <- as.Date(catapult$date, "%m/%d/%y")
catapult

To finish, we will do a bit of clean up and remove the duration and hour_min_sec columns, round the player_load and pract_time columns to one significant digit and create a player_load_per_min column.

catapult %>%
  select(-duration, -hour_min_sec) %>%
  mutate(across(.cols = player_load:pract_time,
                ~round(.x, 1)),
         player_load_per_min = round(player_load / pract_time, 2))

Now we have a cleaned data set that we can worth with!

Access to the full code is available on my GITHUB page.

Episode 131: Player selection in shiny when different players have the same name

This week, Ellis Hughes and I discuss two different approaches to dealing with players who have the same name in {shiny} apps. This is a common issue when working with sports data (and lots of other data where you have a large number of people). If you don’t have a way of correcting for it, your user will select an individual’s name and get returned data for all people with that same name (not ideal).

To watch our screen cast, CLICK HERE.

To access our code, CLICK HERE.