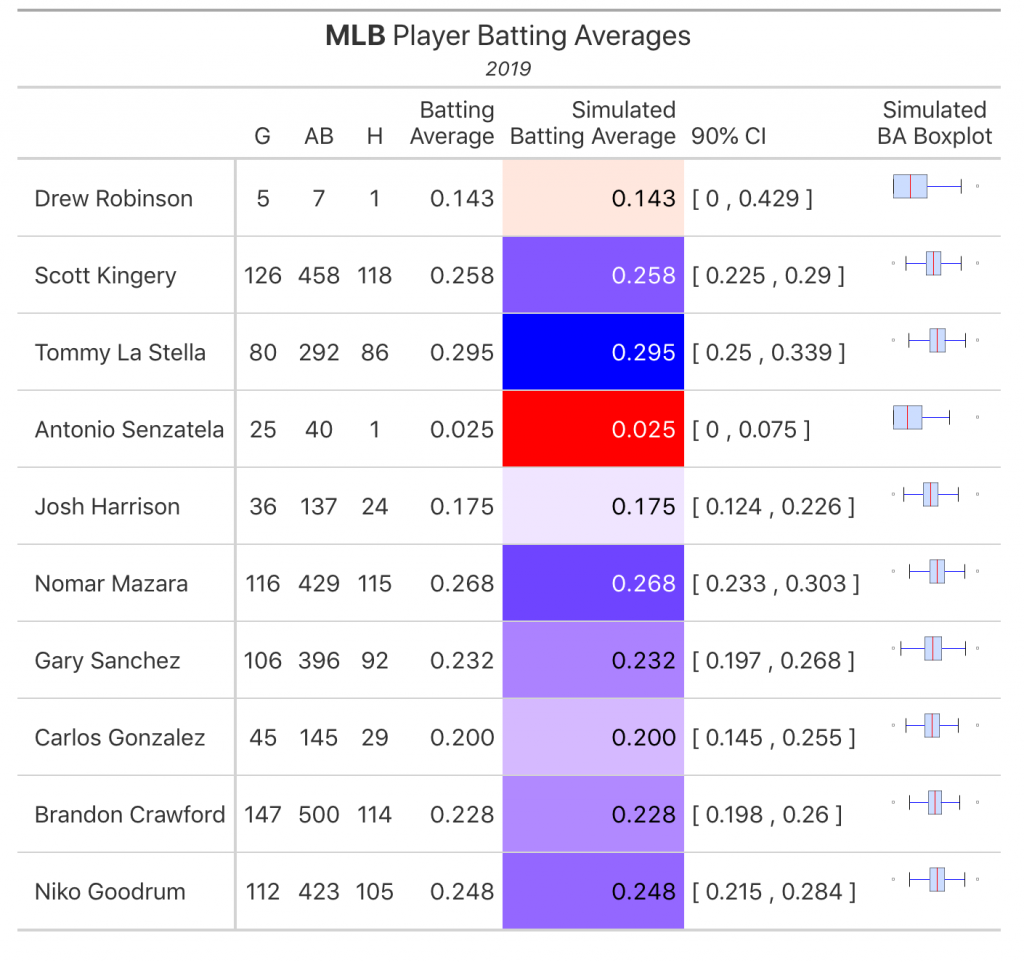
This week, Ellis Hughes and I continue our work on simulation methods in R by introducing the rowwise function from the {tidyverse} package. We use this function to do simulations of batting average at the player level. Basically, the function allows us to easily apply a simulation to each row, which represents one player’s seasons, of the data set. We then build our results into a {gt} table and use sparklines.
To watch our screen cast, CLICK HERE.
To access our code, CLICK HERE.

