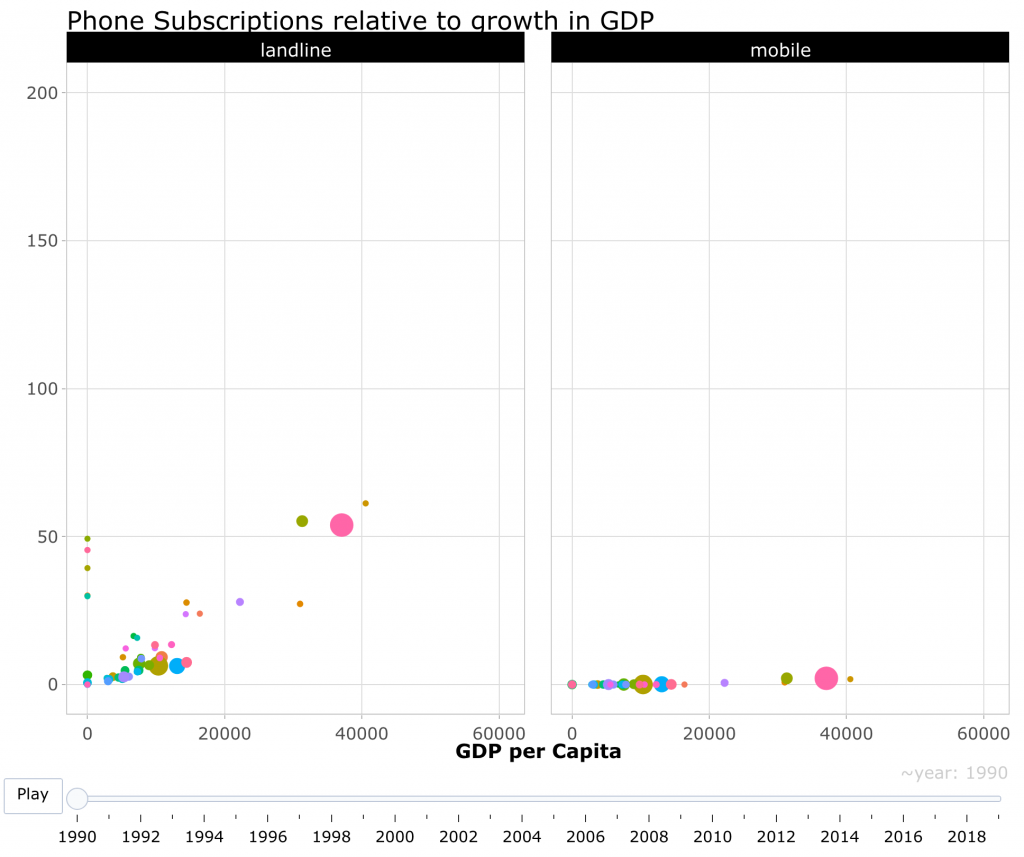
This week, Ellis Hughes and I use the {plotly} package to create a user controlled animation for evaluating trends in changes in landline and cellphone usage from data provided by the Tidy Tuesday Project.
To watch our screen cast, CLICK HERE.
To access our code, CLICK HERE.

