R Tips & Tricks: Normalizing test dates & calculating test differences

A friend of mine was downloading some force plate data from the software provider so that he could evaluate test data in a few of his athletes during return to play. The issue he was running into was that the different athletes all had different numbers of tests and different start and end testing times. The software exports the test outputs by date and he was wondering how he could normalize the dates to numeric values (e.g. Test 1, Test 2, etc.) so that he could model the date (since we can’t really use a Date in a regression model).

I’ll be the first to admit that working with dates and times can be an incredible pain in the butt. For reference, I covered the topic of converting Catapult GPS practice duration strings to actual training minutes, HERE. To help him out, I provided a few different solutions depending on the research question. I also add some code for calculating changes in test performance between tests and from each test to baseline.

The full code is available on my GITHUB page.

Loading Packages & Simulating Data

## load packages ----------------------------------------------
library(tidyverse)
library(lubridate)

## Simulate data ----------------------------------------------
set.seed(78)
dat <- tibble(
  
  athlete = rep(c("Tom", "Bob", "Franklin"), times = c(5, 10, 3)),
  test_dates = c(
    seq(as.Date("2023-01-01"), as.Date("2023-01-5"), by = "days"),
    seq(as.Date("2023-02-15"), as.Date("2023-02-24"), by = "days"),
    as.Date(c("2023-01-19", "2023-01-30", "2023-02-26"))
  ),
  jump_height = round(rnorm(n = 18, mean = 28, sd = 2.5), 1)
  
)

dat


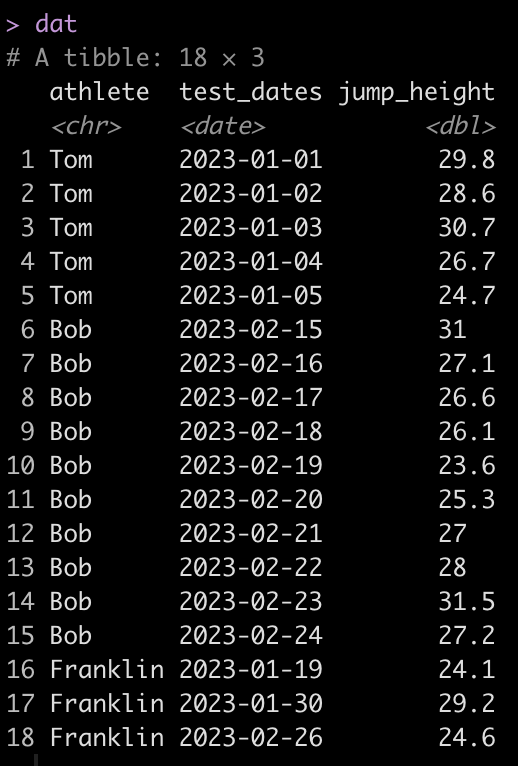
We can see that Tom has 5 tests, Bob has 10, and Franklin has only 3. Additionally, Tom and Bob tested every day, consecutively, while Franklin was less compliant and has larger time frames between his tests.

Create a test number

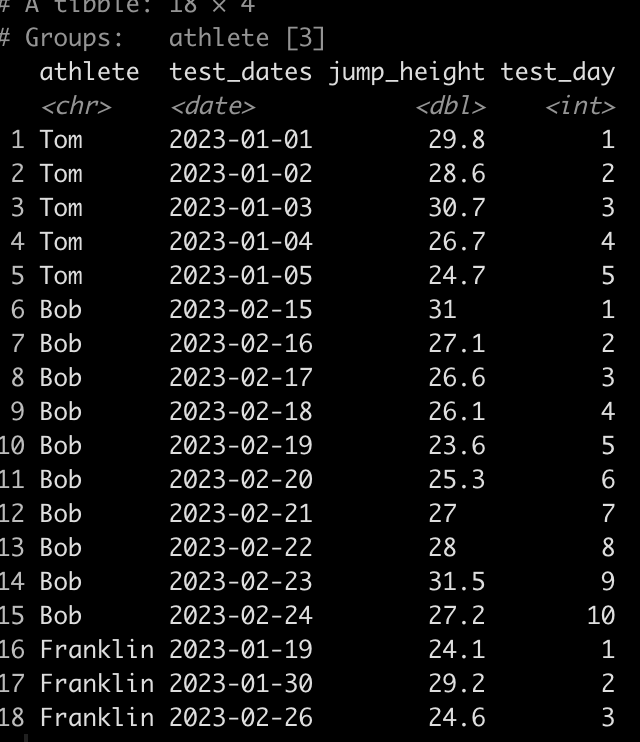
First, let’s normalize the Dates so that they are numeric. Basically, instead of dates we want a value indicating whether the test was test 1, or test 5, or test N. We will do this by creating a row_number() id/counter for each individual athlete.

### Create a test number ------------------------------------------
dat <- dat %>%
  group_by(athlete) %>%
  mutate(test_day = row_number())

dat

Calculating the time between tests

Alternatively, we may not just want to know the test number of each test but we may want to determine the amount of days between each test.

The code to do this is a bit ugly looking so let’s unpack it.

  1. Since we are dealing with dates we use the difftime() function which takes an argument for the two times you are looking to calculate the difference between. Here, we are trying to calculate the difference in time (days) between one date and the date preceding it for each individual athlete.
  2. The difftime() function will produce a to time variable. If we want to make this numeric we need to convert it to a character so we do that with the as.character() function.
  3. Once the variable is a character we use the as.numeric() function to convert it to a numeric value.
  4. Finally, since the first value for each athlete will be an NA, since there is no date preceding the first test, we use the coalesce() function to fill in a 0 value for each of the NA’s, to indicate that this was the first test and thus there was no time between it and any other test.
### Calculate the time between tests -------------------------------
dat <- dat %>%
  group_by(athlete) %>%
  mutate(time_btw_tests = coalesce(as.numeric(as.character(difftime(test_dates, lag(test_dates)))), 0))

dat

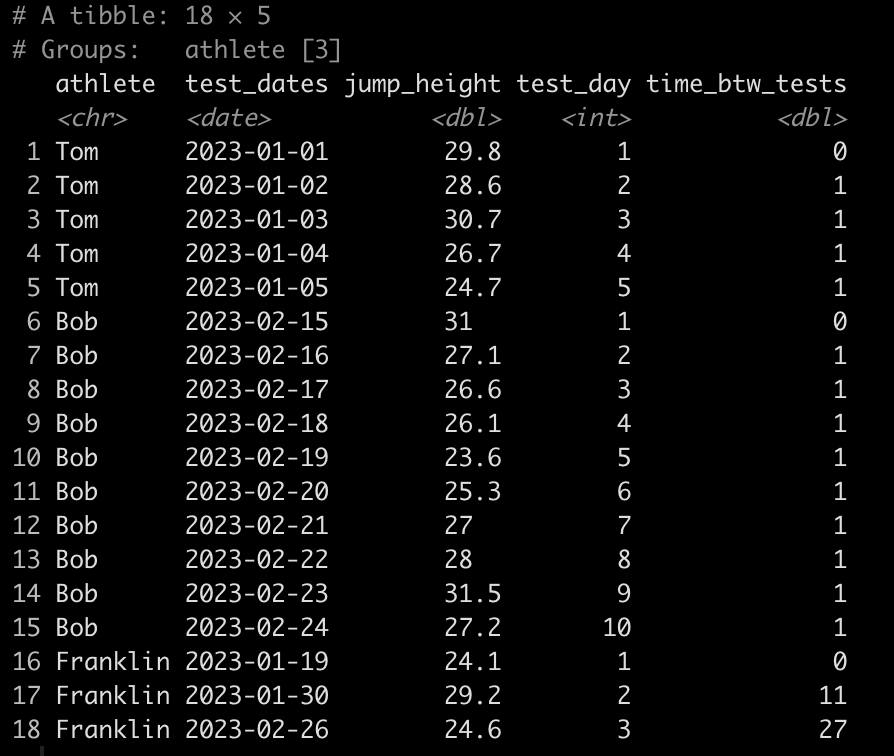
Notice that Tom and Bob have 1 day between all of their tests while Franklin’s second test was 11 days after his first and his third test was 27 days after his second.

Calculate the difference in jump height from one test to the next

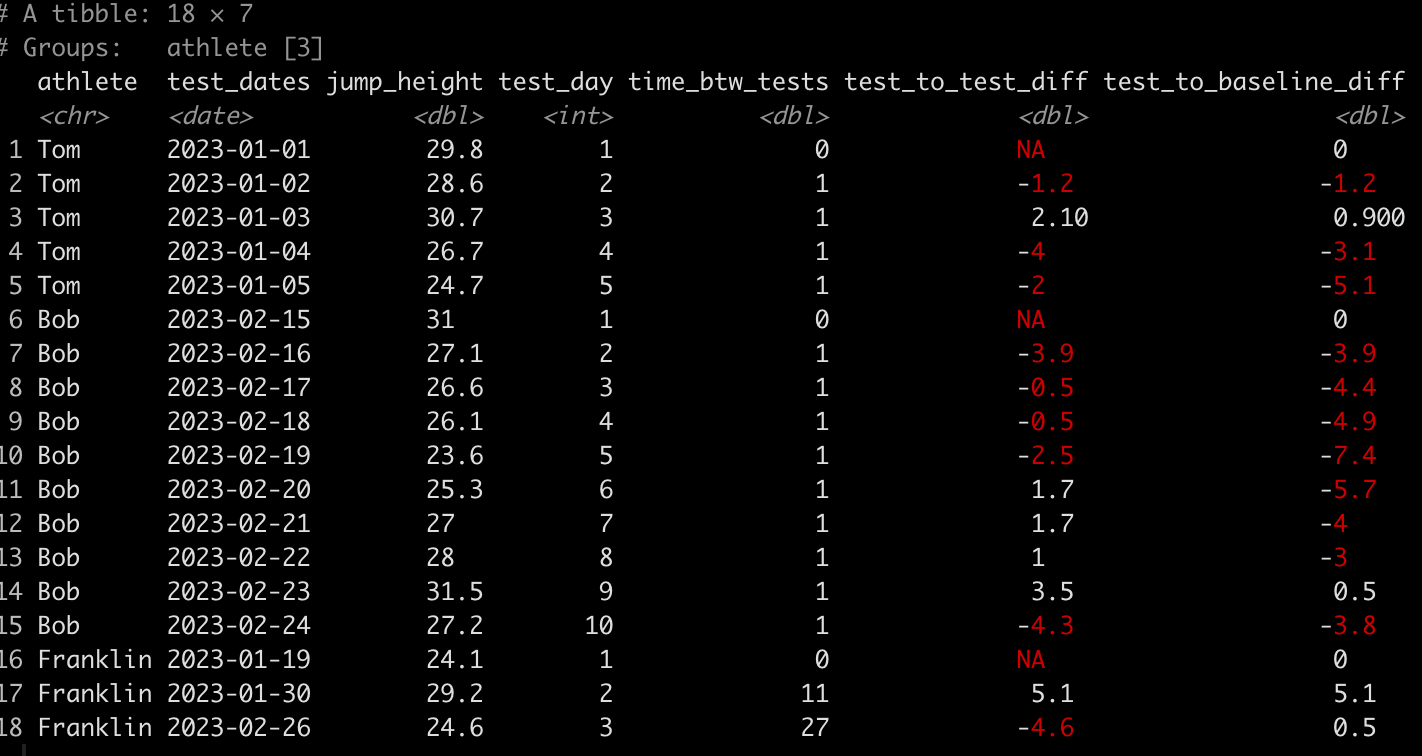
### Calculate difference in jump height from one day to the next -------------------
dat <- dat %>%
  group_by(athlete) %>%
  mutate(test_to_test_diff = jump_height - lag(jump_height))

dat

Here, we use the lag() function to calculate the difference in one value from the value before it within in the same column. Since we grouped by athlete, which is what we want, their first test will always have an NA, in this new column, since there was no test preceding it.

Calculating the difference in jump height from the baseline test

Finally, we might also be interested to evaluate the performance on each test relative to the athlete’s baseline test. To do this we simply subtract jump_height from the jump_height indexed in row one for each athlete.

### Calculate difference in jump height from each test to the baseline test -------------

dat <- dat %>%
  group_by(athlete) %>%
  mutate(test_to_baseline_diff = jump_height - jump_height[1])

dat

Wrapping Up

Dates and times are always tricky to deal with. Most of the sports technology providers will proved data as dates (or unix timestamps) meaning that we have to do some cleaning of the data to codify the dates as numeric values representing the test number or the days between tests (depending on the research question). Additionally, using lag functions can be helpful for calculating he difference from one test to the next or from each test to the baseline.

The entire code is available on my GITHUB page.

If you have any data cleaning issues that you are dealing with from various sports science technologies, feel free to reach out!

TidyX 146: Adding a download option to Shiny apps

This week, Ellis Hughes and I discuss how to add a download button to the user interface of a {shiny} app. We provide two options for completing this task:

  1. Using a downloadHandler(), which requires some additional coding but produces a nice downloadable PDF.
  2. Using the {shinyscreenshot} package, which offers a very simple button to click and produce a screen shot of the shiny page in a PNG form.

To watch our screen cast, CLICK HERE.

To access our code, CLICK HERE.

TidyX Episode 145: Multi-Input Shiny Apps

This week, Ellis Hughes and I show a way to create a multi-input {shiny} app with a dynamic click table using the {DT} package.

The app has 2 tabs. One tab with a table of summary data and a second tab with individual player information and plots of data. The user interface is constructed in such a way that allows user to go to Tab 1, investigate the summary data and click on any of the rows and be immediately taken to that player’s data in Tab 2. Alternatively, the user can go directly to Tab 2 and simply scroll through and observe data for players they are interested in.

To watch our screen cast, CLICK HERE.

To access our code, CLICK HERE.

Different ways of calculating intervals of uncertainty

I’ve talked a lot in this blog about making predictions (see HERE, HERE, and HERE) as well as the difference between confidence intervals and prediction intervals and why you’d use one over the other (see HERE). Tonight I was having a discussion with a colleague about some models he was working on and he was building some confidence intervals around his predictions. That got me to thinking about the various ways we can code confidence intervals, quantile intervals, and prediction intervals in R. So, I decided to put together this quick tutorial to provide a few different ways of constructing these values (after all, unless we can calculate the uncertainty in our predictions, point estimate predictions are largely useless on their own).

The full code is available on my GITHUB page.

Load packages, get data, and fit regression model

The only package we will need is {tidyverse}, the data will be the mtcars dataset and the model will be a linear regression which attempts to predict mpg from wr and carb.

## Load packages
library(tidyverse)

theme_set(theme_classic())

## Get data
d <- mtcars d %>%
  head()

## fit model
fit_lm <- lm(mpg ~ wt + carb, data = d)
summary(fit_lm)

Get some data to make predictions on

We will just grab a random sample of 5 rows from the original data set and use that to make some predictions on.

## Get a few rows to make predictions on
set.seed(1234)
d_sample <- d %>%
  sample_n(size = 5) %>%
  select(mpg, wt, carb)

d_sample

Confidence Intervals with the predict() function

Using preidct() we calculate the predicted value with 95% Confidence Intervals.

## 95% Confidence Intervals
d_sample %>%
  bind_cols(
    predict(fit_lm, newdata = d_sample, interval = "confidence", level = 0.95)
  )


Calculate confidence intervals by hand

Instead of using the R function, we can calculate the confidence intervals by hand (and obtain the same result).

## Calculate the 95% confidence interval by hand
level <- 0.95
alpha <- 1 - (1 - level) / 2
t_crit <- qt(p = alpha, df = fit_lm$df.residual) 

d_sample %>%
  mutate(pred = predict(fit_lm, newdata = .),
         se_pred = predict(fit_lm, newdata = ., se = TRUE)$se.fit,
         cl95 = t_crit * se_pred,
         lwr = pred - cl95,
         upr = pred + cl95)


Calculate confidence intervals with the qnorm() function

Above, we calculated a 95% t-critical value for the degrees of freedom of our model. Alternatively, we could calculate 95% confidence intervals using the standard z-critical value for 95%, 1.96, which we obtain with the qnorm() function.

d_sample %>%
  mutate(pred = predict(fit_lm, newdata = .),
         se_pred = predict(fit_lm, newdata = ., se = TRUE)$se.fit,
         lwr = pred + qnorm(p = 0.025, mean = 0, sd = 1) * se_pred,
         upr = pred + qnorm(p = 0.975, mean = 0, sd = 1) * se_pred)

Calculate quantile intervals via simulation

Finally, we can calculate quantile intervals by simulating predictions using the predicted value and standard error for each of the observations. We simulate 1000 times from a normal distribution and then use the quantile() function to get our quantile intervals.

If all we care about is a predicted value and the lower and upper intervals, we can use the rowwise() function to indicate that we are going to do a simulation for each row and then store the end result (our lower and upper quantile intervals) in a new column.

## 95% Quantile Intervals via Simulation
d_sample %>%
  mutate(pred = predict(fit_lm, newdata = .),
         se_pred = predict(fit_lm, newdata = ., se = TRUE)$se.fit) %>%
  rowwise() %>%
  mutate(lwr = quantile(rnorm(n = 1000, mean = pred, sd = se_pred), probs = 0.025),
         upr = quantile(rnorm(n = 1000, mean = pred, sd = se_pred), probs = 0.975))

While that is useful, there might be times where we want to extract the full simulated distribution. We can create a simulated distribution (1000 simulations) for each of the 5 observations using a for() loop.

## 95% quantile intervals via Simulation with full distribution
N <- 1000
pred_sim <- list()

set.seed(8945)
for(i in 1:nrow(d_sample)){
  
  pred <- predict(fit_lm, newdata = d_sample[i, ])
  se_pred <- predict(fit_lm, newdata = d_sample[i, ], se = TRUE)$se.fit
  
  pred_sim[[i]] <- rnorm(n = N, mean = pred, sd = se_pred)
  
}

sim_df <- tibble( sample_row = rep(1:5, each = N), pred_sim = unlist(pred_sim) ) 

sim_df %>%
  head()


Next we summarize the simulation for each observation.

# get predictions and quantile intervals
sim_df %>%
  group_by(sample_row) %>%
  summarize(pred = mean(pred_sim),
         lwr = quantile(pred_sim, probs = 0.025),
         upr = quantile(pred_sim, probs = 0.975)) %>%
  mutate(sample_row = rownames(d_sample))


We can then plot the entire posterior distribution for each observation.

# plot the predicted distributions
sim_df %>%
  mutate(actual_value = rep(d_sample$mpg, each = N),
         sample_row = case_when(sample_row == 1 ~ "Hornet 4 Drive",
                                sample_row == 2 ~ "Toyota Corolla",
                                sample_row == 3 ~ "Honda Civic",
                                sample_row == 4 ~ "Ferrari Dino",
                                sample_row == 5 ~ "Pontiac Firebird")) %>%
  ggplot(aes(x = pred_sim)) +
  geom_histogram(color = "white",
                 fill = "light grey") +
  geom_vline(aes(xintercept = actual_value),
             color = "red",
             size = 1.2,
             linetype = "dashed") +
  facet_wrap(~sample_row, scale = "free_x") +
  labs(x = "Predicted Simulation",
       y = "count",
       title = "Predicted Simulation with actual observation (red line)",
       subtitle = "Note that the x-axis are specific to that simulation and not the same")

Prediction Intervals with the predict() function

Next we turn attention to prediction intervals, which will be wider than the confidence intervals because they are incorporating additional uncertainty.

The predict() function makes calculating prediction intervals very convenient.

## 95% Prediction Intervals
d_sample %>%
  bind_cols(
    predict(fit_lm, newdata = d_sample, interval = "predict", level = 0.95)
  )

Prediction Intervals from a simulated distribution

Similar to how we simulated a distribution for calculating quantile intervals, above, we will perform the same procedure here. The difference is that we need to get the residual standard error (RSE) from our model as we need to add this additional piece of uncertainty (on top of the predicted standard error) to each of the simulated predictions.

## 95% prediction intervals from a simulated distribution 
# store the model residual standard error
sigma <- summary(fit_lm)$sigma

# run simulation
N <- 1000
pred_sim2 <- list()

set.seed(85)
for(i in 1:nrow(d_sample)){
  
  pred <- predict(fit_lm, newdata = d_sample[i, ])
  se_pred <- predict(fit_lm, newdata = d_sample[i, ], se = TRUE)$se.fit
  
  pred_sim2[[i]] <- rnorm(n = N, mean = pred, sd = se_pred) + rnorm(n = N, mean = 0, sd = sigma)
  
}

# put results in a data frame
sim_df2 <- tibble( sample_row = rep(1:5, each = N), pred_sim2 = unlist(pred_sim2) ) 

sim_df2 %>%
  head()

We summarize our predictions and their intervals.

# get predictions and intervals
sim_df2 %>%
  group_by(sample_row) %>%
  summarize(pred = mean(pred_sim2),
            lwr = quantile(pred_sim2, probs = 0.025),
            upr = quantile(pred_sim2, probs = 0.975)) %>%
  mutate(sample_row = rownames(d_sample))

Finally, we plot the simulated distributions for each of the observations.

Wrapping Up

Uncertainty is important to be aware of and convey whenever you share your predictions. The point estimate prediction is one a single value of many plausible values given the data generating process. This article provided a few different approaches for calculating uncertainty intervals. The full code is available on my GITHUB page.

Plotting Mixed Model Outputs

This weekend I posted two new blog articles about building reports that contained both data tables and plots on the same canvas (see HERE and HERE). As a follow up, James Baker asked if I could do some plotting of mixed model outputs. That got me thinking, I’ve done a few blog tutorials on mixed models (see HERE and HERE) and this got me thinking. Because he left it pretty wide open (“Do you have any guides on visualizing mixed models?”) I was trying to think about what aspects of the mixed models he’d like to visualize. R makes it relatively easy to plot random effects using the {lattice} package, but I figured we could go a little deeper and customize some of our own plots of the random effects as well as show how we might plot future predictions from a mixed model.

All of the code for this article is available on my GITHUB page.

Loading Packages & Data

As always we begin by loading some of the packages we require and the data. In this case, we will use the sleepstudy dataset, which is freely available from the {lme4} package.

## Load packages
library(tidyverse)
library(lme4)
library(lattice)
library(patchwork)

theme_set(theme_bw())

## load data
dat <- sleepstudy dat %>%
  head()

Fit a mixed model

We will fit a mixed model that sets the dependent variable as Reaction time and the fixed effect as days of sleep deprivation. We will also allow both the intercept and slope to vary randomly by nesting the individual SubjectID within each Day of sleep deprivation.

## Fit mixed model
fit_lmer <- lmer(Reaction ~ Days + (1 + Days|Subject), data = dat)
summary(fit_lmer)

Inspect the random effects

We can see in the model output above that we have a random effect standard deviation for the Intercept (24.84) and for the slope, Days (5.92). We can extract out the random effect intercept and slope for each subject with the code below. This tells us how much each subject’s slope and intercept vary from the population fixed effects (251.4 and 10.5 for the intercept and slope, respectively).

# look at the random effects
random_effects <- ranef(fit_lmer) %>%
  pluck(1) %>%
  rownames_to_column() %>%
  rename(Subject = rowname, Intercept = "(Intercept)") 

random_effects %>%
  knitr::kable()

Plotting the random effects

Aside from looking at a table of numbers, which can sometimes be difficult to draw conclusions from (especially if there are a large number of subjects) we can plot the data and make some observational inference.

The {lattice} package allows us to create waterfall plots of the random effects for each subject with the dotplot() function.

## plot random effects
dotplot(ranef(fit_lmer))

That’s a pretty nice plot and easy to obtain with just a single line of code. But, we might want to create our own plot using {ggplot2} so that we have more control over the styling.

I’ll store the standard deviation of the random slope and intercept, from the model read out above, in their own element. Then, I’ll use the random effects table we made above, which contains the intercept and slope of each subject, to plot them and add the standard deviation to them as error bars.

## Make one in ggplot2
subject_intercept_sd <- 24.7
subject_days_sd <- 5.92

int_plt <- random_effects %>%
mutate(Subject = as.factor(Subject)) %>%
ggplot(aes(x = Intercept, y = reorder(Subject, Intercept))) +
geom_errorbar(aes(xmin = Intercept - subject_intercept_sd,
xmax = Intercept + subject_intercept_sd),
width = 0,
size = 1) +
geom_point(size = 3,
shape = 21,
color = "black",
fill = "white") +
geom_vline(xintercept = 0,
color = "red",
size = 1,
linetype = "dashed") +
scale_x_continuous(breaks = seq(-60, 60, 20)) +
labs(x = "Intercept",
y = "Subject ID",
title = "Random Intercepts")

slope_plt <- random_effects %>%
mutate(Subject = as.factor(Subject)) %>%
ggplot(aes(x = Days, y = reorder(Subject, Days))) +
geom_errorbar(aes(xmin = Days - subject_days_sd,
xmax = Days + subject_days_sd),
width = 0,
size = 1) +
geom_point(size = 3,
shape = 21,
color = "black",
fill = "white") +
geom_vline(xintercept = 0,
color = "red",
size = 1,
linetype = "dashed") +
xlim(-60, 60) +
labs(x = "Slope",
y = "Subject ID",
title = "Random Slopes")

slope_plt / int_plt

We get the same plot but now we have more control. We can color the dot specific subjects, or only choose to display specific subjects, or flip the x- and y-axes, etc.

Plotting the model residuals

We can also plot the model residuals. Using the residual() function we can get the residuals directly from our mixed model and the plot() function with automatically plot the Residual and Fitted values. These types of plots are useful for exploring assumptions such as normality of the residuals and homoscedasticity.

## Plot Residual
plot(fit_lmer)
hist(resid(fit_lmer))

As above, perhaps we want to have more control over the bottom plot, so that we can style it however we’d like. We can extract the fitted values and residuals and build our own plot using base R.

## Plotting our own residual ~ fitted
lmer_fitted <- predict(fit_lmer, newdata = dat, re.form = ~(1 + Days|Subject))
lmer_resid <- dat$Reaction - lmer_fitted

plot(x = lmer_fitted,
     y = lmer_resid,
     pch = 19,
     main = "Resid ~ Fitted",
     xlab = "Fitted",
     ylab = "Residuals")
abline(h = 0,
       col = "red",
       lwd = 3,
       lty = 2)

Plotting Predictions

The final plot I’ll build are the predictions of Reaction time as Days of sleep deprivation increase. This is time series data, so I’m going to extract the first 6 days of sleep deprivation for each subject and build the model using that data. Then, make predictions on the next 4 days of sleep deprivation for each subject and get both a predicted point estimate and 90% prediction interval. In this way, we can observe the next 4 days of sleep deprivation for each subject and see how far outside of what we would expect (from our mixed model predictions) those values fall.


### Plotting the time series on new data
# training set
dat_train <- dat %>%
  group_by(Subject) %>%
  slice(head(row_number(), 6)) %>%
  ungroup()

# testing set
dat_test <- dat %>%
  group_by(Subject) %>%
  slice(tail(row_number(), 4)) %>%
  ungroup()

## Fit mixed model
fit_lmer2 <- lmer(Reaction ~ Days + (1 + Days|Subject), data = dat_train)
summary(fit_lmer2)

# Predict on training set
train_preds  <- merTools::predictInterval(fit_lmer2, newdata = dat_train, n.sims = 100, returnSims = TRUE, seed = 657, level = 0.9) %>%
  as.data.frame()

dat_train <- dat_train %>% bind_cols(train_preds)

dat_train$group <- "train"

# Predict on test set with 90% prediction intervals
test_preds  <- merTools::predictInterval(fit_lmer2, newdata = dat_test, n.sims = 100, returnSims = TRUE, seed = 657, level = 0.9) %>%
  as.data.frame()

dat_test <- dat_test %>% bind_cols(test_preds)

dat_test$group <- "test"

## Combine the data together
combined_dat <- bind_rows(dat_train, dat_test) %>%
  arrange(Subject, Days)

## Plot the time series of predictions and observed data
combined_dat %>%
mutate(group = factor(group, levels = c("train", "test"))) %>%
ggplot(aes(x = Days, y = Reaction)) +
  geom_ribbon(aes(ymin = lwr,
                  ymax = upr),
              fill = "light grey",
              alpha = 0.8) +
  geom_line(aes(y = fit),
            col = "red",
            size = 1) +
  geom_point(aes(fill = group),
             size = 3,
             shape = 21) +
  geom_line() +
  facet_wrap(~Subject) +
  theme(strip.background = element_rect(fill = "black"),
        strip.text = element_text(face = "bold", color = "white"),
        legend.position = "top") +
  labs(x = "Days",
       y = "Reaction Time",
       title = "Reaction Time based on Days of Sleep Deprivation")

Wrapping Up

Above are a few different plot options we have with mixed model outputs. I’m not sure what James was after or what he had in mind because he left the question very wide open. Hopefully this article provides some useful ideas for your own mixed model plotting. If there are other things you are hoping to see or have other ideas of things to plot from the mixed model output, feel free to reach out!

The complete code for this article is available on my GITHUB page.