Since I’ve been talking about approaches to sharing and visualizing athlete performance data lately, I decided to put together some quick code for developing collapsible tables with the {reactable} package in R.
I like Reactable tables because they offer a simple framework for quickly building interactive html reports for your end user. You can also embed these into {Rmarkdown} reports or {shiny} apps.
Why do we need collapsible tables?
- The collapsible nature educes the amount of real estate they take up in the end user’s report. Instead of a big long table, the user can take the information in chunks without getting distracted.
- When embedding a collapsible table into your {Rmarkdown} or {shiny} reports, it makes them look less busy.
- In meetings, if you have a large number of athletes to discuss, spread across several positions, a large table allows the meeting attendees to have “busy eyes“, as they scan up and down the table and get ahead of things. With a collapsible table, you are able to direct their attention to the aspects you are discussing.
You can access all of the code on my GITHUB page and use it as a template to construct your own collapsible interactive tables. I tried to add several different styling options to the various columns so that it covers many of the things people attempt to do when building reports (e.g., conditional formatting, conditional formatting using information contained in a secondary column, rounding numbers, converting values to percentages, hiding columns you don’t want in the table, etc.).
To play with the html table yourself, CLICK HERE >> collapsible tables with reactable
Examples of the table
The data came from the {Lahman} baseball data set in R. I build a table that nests the players within their respective teams and the teams nested within their respective league (NL or AL). So, this table has 2 structures of collapsing. The table of the table looks like this:
Notice that all we see are the headers (which I’ve set a filterable function under) and the top level of nesting (league).
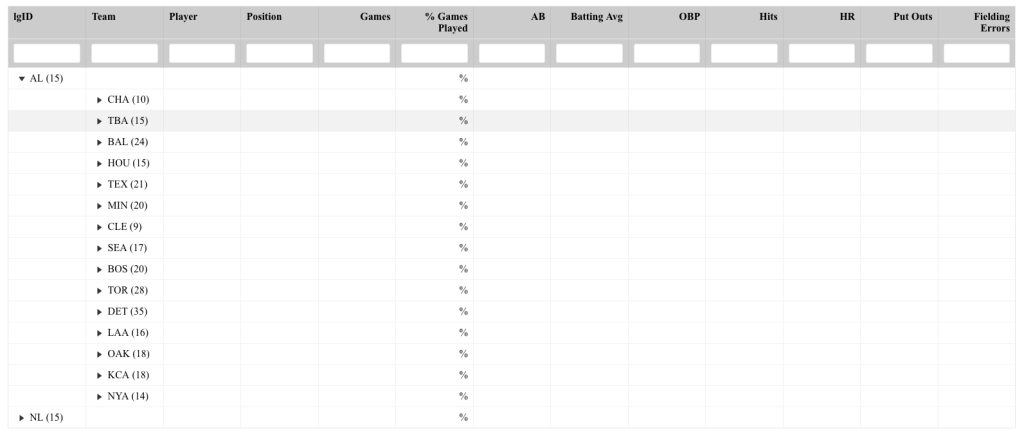
If you click one of the league drop downs, you expand out and see the second level of testing (teams):

Finally, you can click down into any team and obtain the list of players and their stat lines:
Within the code, you’ll notice that I created a simple z-score for each of the stats. The shading is relative to the z-scores; however, to de-clutter the table, I’ve hidden those columns but retain their meaning by using the conditional formatting.
If a person is at the highest level of nesting (league) and wants to just search for a player, that is also possible:
As you can see, collapsible interactive tables can be a great way to share data in a clean way and prevents the end user from being overwhelmed by long and extensive amounts of data across many rows and columns.


