Earlier this week, I briefly discussed a few ways of making various predictions from a Bayesian Regression Model. That article took advantage of the Bayesian scaffolding provided by the {rstanarm} package which runs {Stan} under the hood, to fit the model.
As is often the case, when possible, I like to do a lot of the work by hand — partially because it helps me learn and partially because I’m a glutton for punishment. So, since we used {rstanarm} last time I figured it would be fun to write our own Bayesian simple linear regression by hand using a Gibbs sampler.
To allow us to make a comparison to the model fit in the previous article, I’ll use the same data set and refit the model in {rstanarm}.
Data & Model
library(tidyverse)
library(patchwork)
library(palmerpenguins)
library(rstanarm)

theme_set(theme_classic())

## get data
dat <- na.omit(penguins)
adelie <- dat %>%
  filter(species == "Adelie") %>%
  select(bill_length_mm, bill_depth_mm)

## fit model
fit <- stan_glm(bill_depth_mm ~ bill_length_mm, data = adelie)
summary(fit)
Build the Model by Hand
Some Notes on the Gibbs Sampler
- A Gibbs sampler is one of several Bayesian sampling approaches.
- The Gibbs sampler works by iteratively going through each observation, updating the previous prior distribution and then randomly drawing a proposal value from the updated posterior distribution.
- In the Gibbs sampler, the proposal value is accepted 100% of the time. This last point is where the Gibbs sampler differs from other samples, for example the Metropolis algorithm, where the proposal value drawn from the posterior distribution is compared to another value and a decision is made about which to accept.
- The nice part about the Gibbs sampler, aside from it being easy to construct, is that it allows you to estimate multiple parameters, for example the mean and the standard deviation for a normal distribution.
What’s needed to build a Gibbs sampler?
To build the Gibbs sampler we need a few values to start with.
- We need to set some priors on the intercept, slope, and sigma value. This isn’t different from what we did in {rstanarm}; however, recall that we used the default, weakly informative priors provided by the {rstanarm} library. Since we are constructing our own model we will need to specify the priors ourselves.
- We need the values of our observations placed into their own respective vectors.
- We need a start value for the intercept and slope to help get the process going.
That’s it! Pretty simple. Let’s specify these values so that we can continue on.
Setting our priors
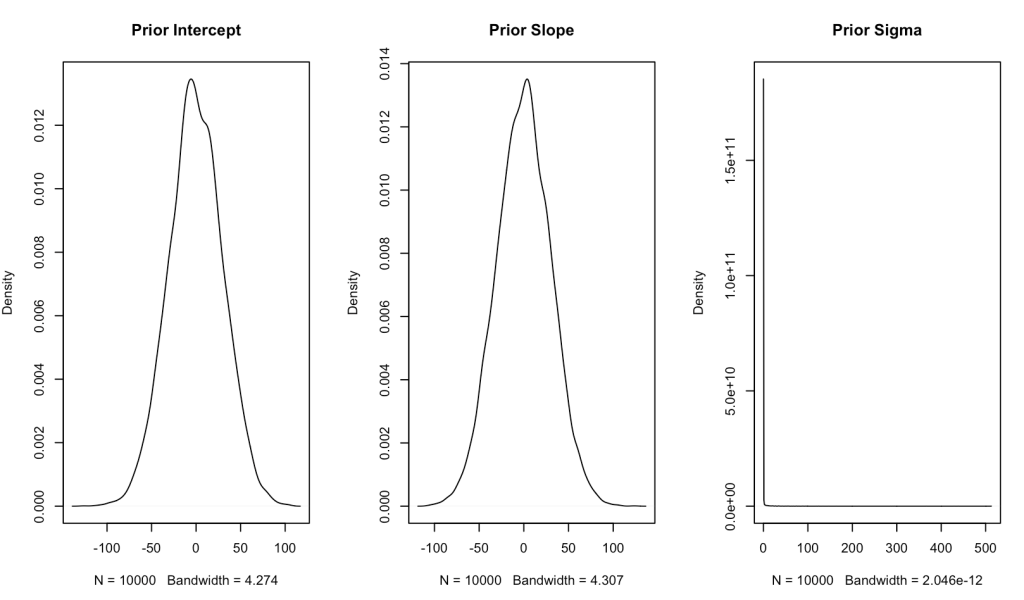
Since we have no real prior knowledge about the bill depth of Adelie penguins and don’t have a good sense for what the relationship between bill length and bill depth is, we will set our own weakly informative priors. We will specify both the intercept and slope to be normally distributed with a mean of 0 and a standard deviation of 30. Essentially, we will let the data speak. One technical note is that I am converting the standard deviation to precision, which is nothing more than 1 / variance (and recall that variance is just standard deviation squared).
For our sigma prior (which I refer to as tau, below) I’m going to specify a gamma prior with a shape and rate of 0.01.
## set priors
intercept_prior_mu <- 0
intercept_prior_sd <- 30
intercept_prior_prec <- 1/(intercept_prior_sd^2)

slope_prior_mu <- 0
slope_prior_sd <- 30
slope_prior_prec <- 1/(slope_prior_sd^2)

tau_shape_prior <- 0.01
tau_rate_prior <- 0.01
Let’s plot the priors and see what they look like.
## plot priors
N <- 1e4
intercept_prior <- rnorm(n = N, mean = intercept_prior_mu, sd = intercept_prior_sd)
slope_prior <- rnorm(n = N, mean = slope_prior_mu, sd = slope_prior_sd)
tau_prior <- rgamma(n = N, shape = tau_shape_prior, rate = tau_rate_prior)

par(mfrow = c(1, 3))
plot(density(intercept_prior), main = "Prior Intercept", xlab = )
plot(density(slope_prior), main = "Prior Slope")
plot(density(tau_prior), main = "Prior Sigma")
Place the observations in their own vectors
We will store the bill depth and length in their own vectors.
## observations
bill_depth <- adelie$bill_depth_mm
bill_length <- adelie$bill_length_mm
Initializing Values
Because the model runs iteratively, using the data in the previous row as the new prior, we need to get a few values to help start the process before progressing to our observed data, which would be row 1. Essentially, we need to get some values to give us a row 0. We will want to start with some reasonable values and let the model run from there. I’ll start the intercept value off with 20 and the slope with 1.
intercept_start_value <- 20
slope_start_value <- 1
Gibbs Sampler Function
We will write a custom Gibbs sampler function to do all of the heavy lifting for us. I tried to comment out each step within the function so that it is clear what is going on. The function takes an x variable (the independent variable), a y variable (dependent variable), all of the priors that we specified, and the start values for the intercept and slope. The final two arguments of the function are the number of simulations you want to run and the burnin amount. The burnin amount, sometimes referred to as the wind up, is basically the number of simulations that you want to throw away as the model is working to converge. Usually you will be running several thousand simulations so you’ll throw away the first 1000-2000 simulations as the model is exploring the potential parameter space and settling in to something that is indicative of the data. The way the Gibbs sampler slowly starts to find the optimal parameters to define the data is by comparing the estimated result from the linear regression, after each new observation and updating of the posterior distribution, to the actual observed value, and then calculates the sum of squared error which continually adjusts our model sigma (tau).
Each observation is indexed within the for() loop as row “i” and you’ll notice that the loop begins at row 2 and continues until the specified number of simulations are complete. Recall that the reason for starting at row 2 is because we have our starting values for our slope and intercept that kick off the loop and make the first prediction of bill length before the model starts updating (see the second code chunk within the loop).
## gibbs sampler
gibbs_sampler <- function(x, y, intercept_prior_mu, intercept_prior_prec, slope_prior_mu, slope_prior_prec, tau_shape_prior, tau_rate_prior, intercept_start_value, slope_start_value, n_sims, burn_in){

  ## get sample size
  n_obs <- length(y)

  ## initial predictions with starting values
  preds1 <- intercept_start_value + slope_start_value * x
  sse1 <- sum((y - preds1)^2)
  tau_shape <- tau_shape_prior + n_obs / 2

  ## vectors to store values
  sse <- c(sse1, rep(NA, n_sims))

  intercept <- c(intercept_start_value, rep(NA, n_sims))
  slope <- c(slope_start_value, rep(NA, n_sims))
  tau_rate <- c(NA, rep(NA, n_sims))
  tau <- c(NA, rep(NA, n_sims))

  for(i in 2:n_sims){

    # Tau Values
    tau_rate[i] <- tau_rate_prior + sse[i - 1]/2
    tau[i] <- rgamma(n = 1, shape = tau_shape, rate = tau_rate[i])

    # Intercept Values
    intercept_mu <- (intercept_prior_prec*intercept_prior_mu + tau[i] * sum(y - slope[i - 1]*x)) / (intercept_prior_prec + n_obs*tau[i])
    intercept_prec <- intercept_prior_prec + n_obs*tau[i]
    intercept[i] <- rnorm(n = 1, mean = intercept_mu, sd = sqrt(1 / intercept_prec))

    # Slope Values
    slope_mu <- (slope_prior_prec*slope_prior_mu + tau[i] * sum(x * (y - intercept[i]))) / (slope_prior_prec + tau[i] * sum(x^2))
    slope_prec <- slope_prior_prec + tau[i] * sum(x^2)
    slope[i] <- rnorm(n = 1, mean = slope_mu, sd = sqrt(1 / slope_prec))

    preds <- intercept[i] + slope[i] * x
    sse[i] <- sum((y - preds)^2)

  }

  list(
    intercept = na.omit(intercept[-1:-burn_in]),
    slope = na.omit(slope[-1:-burn_in]),
    tau = na.omit(tau[-1:-burn_in]))

}
Run the Function
Now it is as easy as providing each argument of our function with all of the values specified above. I’ll run the function for 20,000 simulations and set the burnin value to 1,000.
sim_results <- gibbs_sampler(x = bill_length,
    y = bill_depth,
    intercept_prior_mu = intercept_prior_mu,
    intercept_prior_prec = intercept_prior_prec,
    slope_prior_mu = slope_prior_mu,
    slope_prior_prec = slope_prior_prec,
    tau_shape_prior = tau_shape_prior,
    tau_rate_prior = tau_rate_prior,
    intercept_start_value = intercept_start_value,
    slope_start_value = slope_start_value,
    n_sims = 20000,
    burn_in = 1000)
Model Summary Statistics
The results from the function are returned as a list with an element for the simulated intercept, slope, and sigma values. We will summarize each by calculating the mean, standard deviation, and 90% Credible Interval. We can then compare what we obtained from our Gibbs Sampler to the results from our {rstanarm} model, which used Hamiltonian Monte Carlo (a different sampling approach).
## Extract summary stats
intercept_posterior_mean <- mean(sim_results$intercept, na.rm = TRUE)
intercept_posterior_sd <- sd(sim_results$intercept, na.rm = TRUE)
intercept_posterior_cred_int <- qnorm(p = c(0.05,0.95), mean = intercept_posterior_mean, sd = intercept_posterior_sd)

slope_posterior_mean <- mean(sim_results$slope, na.rm = TRUE)
slope_posterior_sd <- sd(sim_results$slope, na.rm = TRUE)
slope_posterior_cred_int <- qnorm(p = c(0.05,0.95), mean = slope_posterior_mean, sd = slope_posterior_sd)

sigma_posterior_mean <- mean(sqrt(1 / sim_results$tau), na.rm = TRUE)
sigma_posterior_sd <- sd(sqrt(1 / sim_results$tau), na.rm = TRUE)
sigma_posterior_cred_int <- qnorm(p = c(0.05,0.95), mean = sigma_posterior_mean, sd = sigma_posterior_sd)

## Extract rstanarm values
rstan_intercept <- coef(fit)[1]
rstan_slope <- coef(fit)[2]
rstan_sigma <- 1.1
rstan_cred_int_intercept <- as.vector(posterior_interval(fit)[1, ])
rstan_cred_int_slope <- as.vector(posterior_interval(fit)[2, ])
rstan_cred_int_sigma <- as.vector(posterior_interval(fit)[3, ])

## Compare summary stats to the rstanarm model
## Model Averages
model_means <- data.frame(
  model = c("Gibbs", "Rstan"),
  intercept_mean = c(intercept_posterior_mean, rstan_intercept),
  slope_mean = c(slope_posterior_mean, rstan_slope),
  sigma_mean = c(sigma_posterior_mean, rstan_sigma)
)

## Model 90% Credible Intervals
model_cred_int <- data.frame(
  model = c("Gibbs Intercept", "Rstan Intercept", "Gibbs Slope", "Rstan Slope", "Gibbs Sigma","Rstan Sigma"),
  x5pct = c(intercept_posterior_cred_int[1], rstan_cred_int_intercept[1], slope_posterior_cred_int[1], rstan_cred_int_slope[1], sigma_posterior_cred_int[1], rstan_cred_int_sigma[1]),
  x95pct = c(intercept_posterior_cred_int[2], rstan_cred_int_intercept[2], slope_posterior_cred_int[2], rstan_cred_int_slope[2], sigma_posterior_cred_int[2], rstan_cred_int_sigma[2])
)

## view tables
model_means
model_cred_int
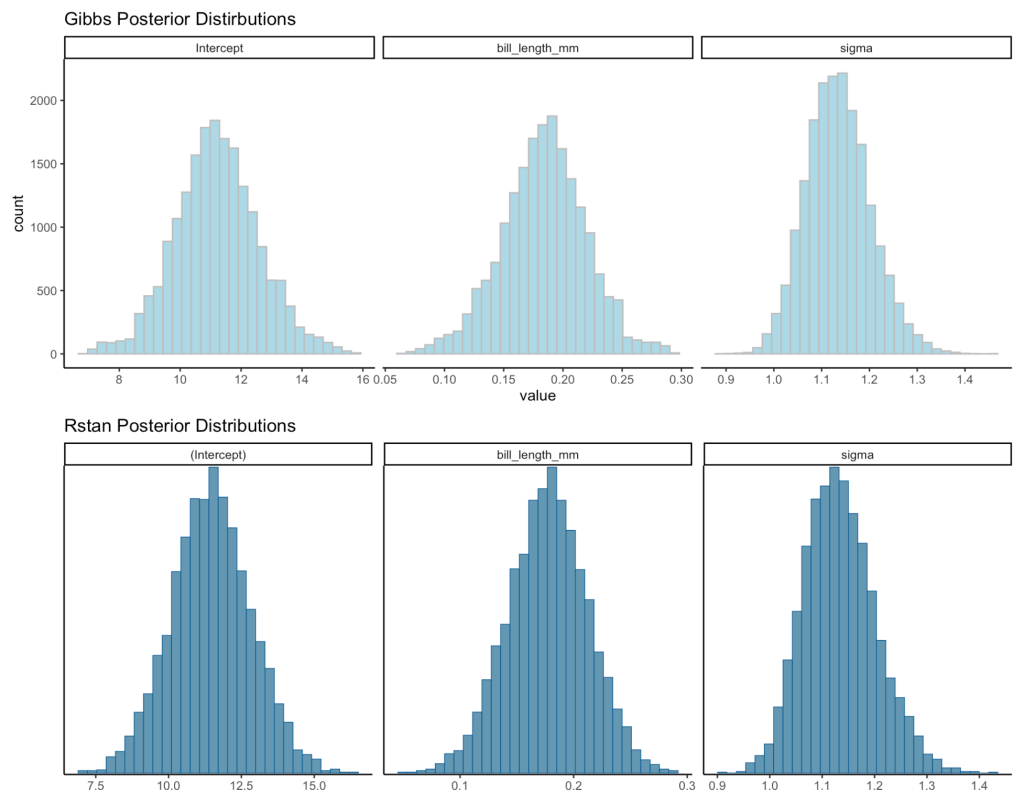
Even though the two approaches use a different sampling method, the results are relatively close to each other.
Visual Comparisons of Posterior Distributions
Finally, we can visualize the posterior distributions between the two models.
# put the posterior simulations from the Gibbs sampler into a data frame
gibbs_posteriors <- data.frame( Intercept = sim_results$intercept, bill_length_mm = sim_results$slope, sigma = sqrt(1 / sim_results$tau) ) %>%
  pivot_longer(cols = everything()) %>%
  arrange(name) %>%
  mutate(name = factor(name, levels = c("Intercept", "bill_length_mm", "sigma")))

gibbs_plot <- gibbs_posteriors %>%
  ggplot(aes(x = value)) +
  geom_histogram(fill = "light blue",
                 color = "grey") +
  facet_wrap(~name, scales = "free_x") +
  ggtitle("Gibbs Posterior Distirbutions")


rstan_plot <- plot(fit, "hist") +
  ggtitle("Rstan Posterior Distributions")


gibbs_plot / rstan_plot
Wrapping Up
We created a simple function that runs a simple linear regression using Gibbs Sampling and found the results to be relatively similar to those from our {rstanarm} model, which uses a different algorithm and also had different prior specifications. It’s often not necessary to write your own function like this, but doing so can be a fun approach to learning a little bit about what is going on under the hood of some of the functions provided in the various R libraries you are using.
The entire code can be accessed on my GitHub page.
Feel free to reach out if you notice any math or code errors.


