One of the easiest things to do in excel is within column iteration. What I mean by this is you create a new column where the starting value is a 0 or a value that occurs in a different column and then all of the following values within that column depend on the value preceding it.
For example, in the below table we can see that we have a value for each corresponding ID. The New Value is calculated as the most recent observation of Value + lag(New Value) – 2. This is true for all observations except the first observation, which simply takes Value of the first ID observation. So, in ID 2, we get: New Value = 7 + 4 – 2 = 9 and in ID 3 we get: New Value = 3 + 9 – 2 = 10.

This type of function is pretty common in excel but it can be a little tricky in R. I’ve been meaning to do a blog about this after a few questions that I’ve gotten and Aaron Pearson reminded me about it last night, so let’s try and tackle it.
Creating Data
We will create two fake data sets:
- Data set 1 will be a larger data set with multiple subjects.
- Data set 2 will only be one subject, a smaller data set for us to first get an understanding of what we are doing before trying to perform the function over multiple people.
library(tidyverse)

## simulate data
set.seed(1)
subject <- rep(LETTERS[1:3], each = 50)
day <- rep(1:50, times = 3)
value <- c(
  round(rnorm(n = 20, mean = 120, sd = 40), 2),
  round(rnorm(n = 10, mean = 150, sd = 20), 2),
  round(rnorm(n = 20, mean = 110, sd = 30), 2),
  round(rnorm(n = 20, mean = 120, sd = 40), 2),
  round(rnorm(n = 10, mean = 150, sd = 20), 2),
  round(rnorm(n = 20, mean = 110, sd = 30), 2),
  round(rnorm(n = 20, mean = 120, sd = 40), 2),
  round(rnorm(n = 10, mean = 150, sd = 20), 2),
  round(rnorm(n = 20, mean = 110, sd = 30), 2))

df_1 <- data.frame(subject, day, value) df_1 %>% head()

### Create a data frame of one subject for a simple example
df_2 <- df_1 %>%
  filter(subject == "A")
Exponentially Weighted Moving Average (EWMA)
We will apply an exponentially weighted moving average to the data as this type of equation requires within column aggregation.
EWMA is calculated as:
EWMA_t = lamda*x_t + (1 – lamda) * Z_t-1
Where:
- EWMA_t = the exponentially weighted moving average value at time t
- Lamda = the weighting factor
- x_t = the most recent observation
- Z_t-1 = the lag of the EWMA value
accumulate()
Within {tidyverse} we will use the accumulate() function, which allows us to create this type of within column aggregation. The function takes a few key arguments:
- First we need to pass the function the name of the column of data with our observations over time
- .y which represents the value of our most recent observation
- .f which is the function that we want to apply to our within column aggregation (in this example we will use the EWMA equation)
- .x which is going to provide us with the lagged value within the new column we are creating
Here is what it looks like in our smaller data set, df_2
df_2 <- df_2 %>%
  mutate(ewma = accumulate(value, ~ lamda * .y + (1 - lamda) * .x))
Here, we are using mutate() to create a new column called ewma. We used accumulate() and passed it the value column, which is the column of our data that has our observations and our function for calculating ewma, which follows the tilde.
Within this function we see .y, the most recent observation and .x, the lag ewma value. By default, the first row of the new ewma column will be the first observation in the value row. Here is what the first few rows of the data look like:
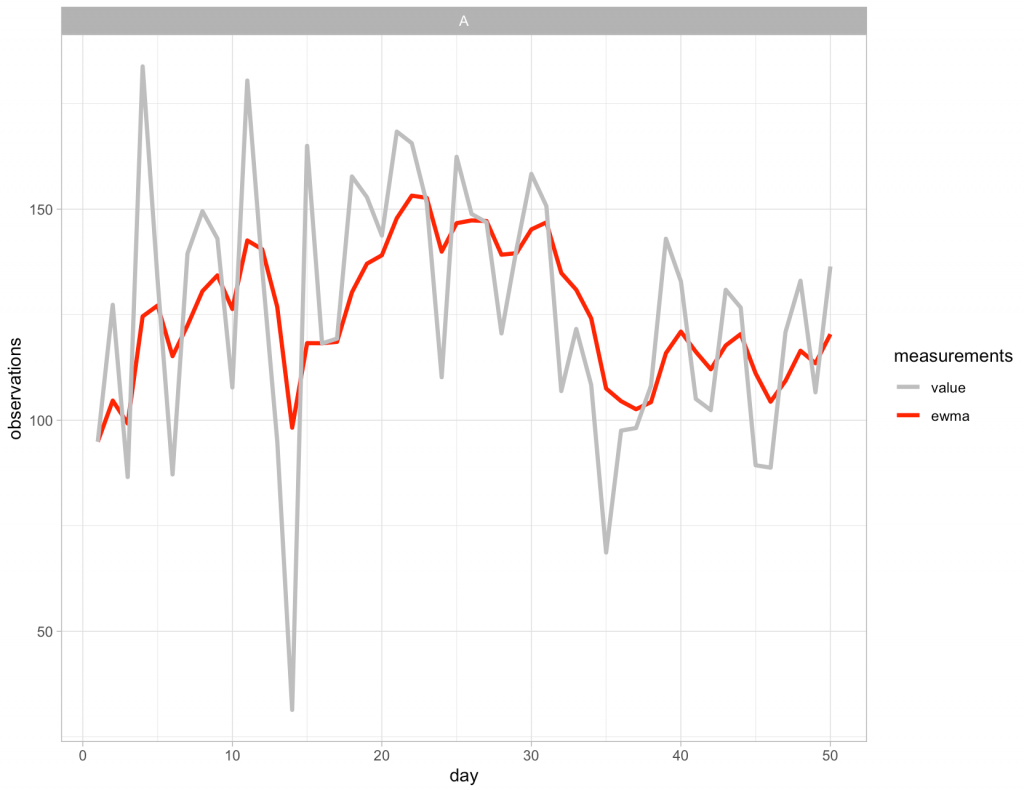
Now that new column has been created we can visualize the observed values and the EWMA values:
Applying the approach to all of the subjects
To apply this approach to all of the subjects in our data we simply need to use the group_by() function to tell R that we want to have the algorithm start over whenever it encounters a new subject ID.
df_1 <- df_1 %>%
  group_by(subject) %>%
  mutate(ewma = accumulate(value, ~ lamda * .y + (1 - lamda) * .x))
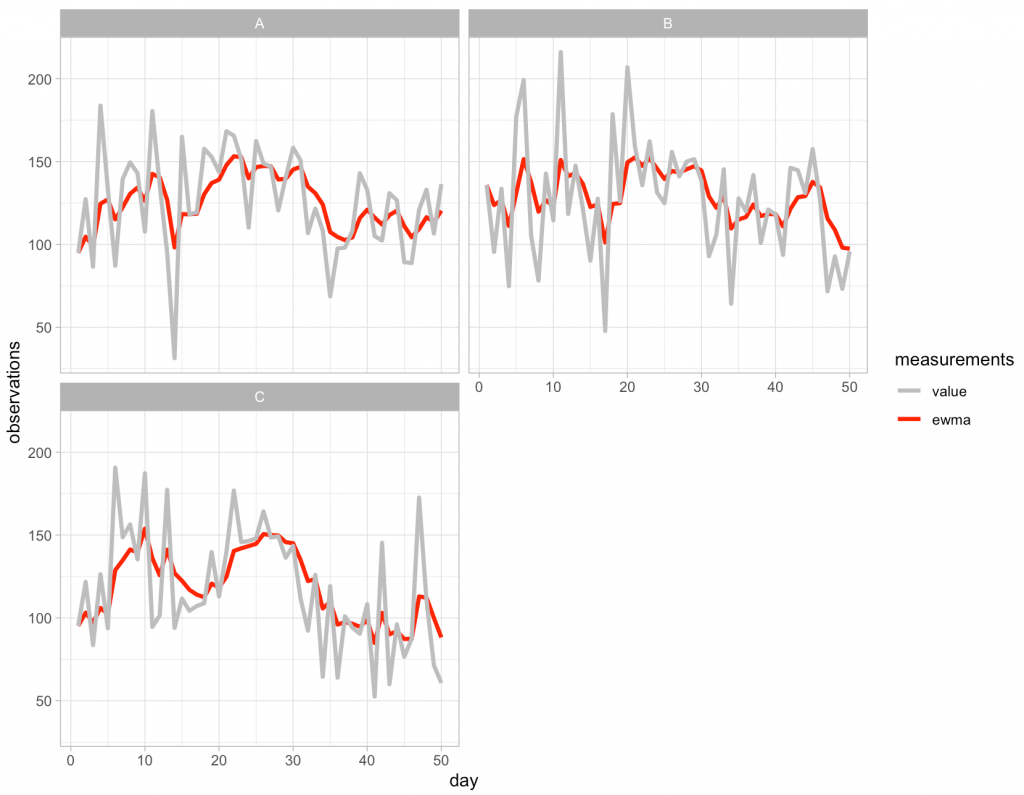
And then we can plot the outcome:
Pretty easy!
What if we want the start value to be 0 (or something else) instead of the first observation?
This is a quick fix within the accumulate() function by using the .init argument and simply passing it whatever value you want the new column to begin with. What you need to be aware of when you do this, however, is that this argument will add an additional observation to the vector of data and thus we need to remove the last row of the data set to ensure that {tidyverse} can perform the operation without giving you an error. To accomplish this, when I pass the value column to the function I add a bracket and then minus 1 of the total count, n(), of observations in that column.
df_2 %>%
  mutate(ewma = accumulate(value[-n()], ~ lamda * .y + (1 - lamda) * .x, .init = 0)) %>%
  head()
Now we see that the first value in ewma is 0 instead of 94.94, which of course changes all of the values following it since the equation is using the lagged ewma value (.x).
For the complete code, please see my GitHub Page.


