A common question sports scientists have is, “how did something that happened yesterday effect today?” For example, the sport scientist might be interested to know how yesterday’s training load influences tomorrow’s level of subjective soreness. In this case, the data is usually offset by a day, as we will see in the example.
Rather than wasting time each day copying and pasting values in excel (and potentially making a mistake), we can use the lag() function from the tidyverse package to manipulate our data into the format we need for analysis.
In today’s R Tips & Tricks blog post I’ll walk through three different approaches to doing this, each a little more complex than the last.
First, let’s load the packages we will need to manipulate our data set.
## Load packages
library(tidyverse)
library(lubridate)
Example 1: Simple Example
First simulate some fake data
day <- 1:10
trainingLoad <- round(rnorm(n = length(day), mean = 460, sd = 60))
soreness <- round(runif(n = length(day), min = 3, max = 6), 0)
df <- data.frame(day, trainingLoad, soreness)
df
We have 10 days recorded and we want to evaluate the training load from the previous day with the soreness of the next day. For example, the training load on day 1 needs to be compared to the level of soreness the next morning, on day 2. As such, the values of interest are offset by one day.
To solve this issue we can use the lag() function for training load. What this will do is take the value one row up and move it one row down.
df %>%
  mutate(trainingLoad_lag = lag(trainingLoad))
Notice that now the 416 training load units on day 1 are on the same row as the soreness on day 2 in our new column, trainingLoad_lag.
Example 2: Working Across Weeks
The above example is rather simple and assumes that all training and soreness reporting take place on consecutive days. Unfortunately, in real life we are often dealing with training across multiple weeks where there may be days off between training sessions.
For example, the data might look like this:
date <- c(seq(as.Date("2020/01/05"), as.Date("2020/01/08"), by = "days"),
          seq(as.Date("2020/01/12"), as.Date("2020/01/15"), by = "days"))
trainingLoad <- round(rnorm(n = length(date), mean = 460, sd = 60), 0)
soreness <- round(runif(n = length(date), min = 3, max = 6), 0)
df <- data.frame(date, trainingLoad, soreness)
df
Let’s look what happens if we blindly apply the lag() function
df %>%
  mutate(trainingLoad_lag = lag(trainingLoad))
Notice the issue here. We have a group of 4 consecutive training sessions that ends on 1/8/2020 and a second group of 4 consecutive sessions starting on 1/12/2020. As such, the lag function just works across the data set and makes the assumption that these are all consecutive days. If we analyzed this data in this fashion we might come up with strange outcomes given that the soreness experienced on 1/12/2020 might not be due to the session that happened 4 days ago on 1/8/2020.
We can solve this issue in one of two ways.
Fix #1: Always create a mesocycle variable in your data to represent the weeks. This will allow you to group_by() that variable.
mesocycle <- rep(c(1, 2), each = 4)
df <- data.frame(mesocycle, df) df # Group by Mesocycle df %>%
  group_by(mesocycle) %>%
  mutate(trainingLoadlag = lag(trainingLoad))
After adding the mesocycle variable and then using it the group_by() function we achieve the correct data manipulation where day 1 of each of the training mesocycles starts with NA in the trainingLoad_lag column indicating that no session occurred the day prior.
Fix #2: Use the week() function from the lubridate package and have R automatically find the week of the year corresponding to the date of the training session.
date <- c(seq(as.Date("2020/01/05"), as.Date("2020/01/08"), by = "days"),
          seq(as.Date("2020/01/11"), as.Date("2020/01/14"), by = "days"))
trainingLoad <- round(rnorm(n = length(date), mean = 460, sd = 60), 0)
soreness <- round(runif(n = length(date), min = 3, max = 6), 0)
df <- data.frame(date, trainingLoad, soreness)
df


# Add in the week
df <- df %>%
  mutate(trainingWeek = week(date))

# Group by trainingWeek

df %>%
  group_by(trainingWeek) %>%
  mutate(trainingLoad_lag = lag(trainingLoad))
Running all of the above code we find that the week() function identified the week of the year based on the date and then we were able to group_by() the training week variable to come to the same outcome as we did in Fix 1.
Example 3: Working Across Weeks with Multiple Athletes
athlete <- rep(LETTERS[1:3], each = 8)
mesocycle <- rep(rep(c(1, 2), each = 4), times = 3)
date <- rep(c(seq(as.Date("2020/01/05"), as.Date("2020/01/08"), by = "days"),
          seq(as.Date("2020/01/12"), as.Date("2020/01/15"), by = "days")), times = 3)
trainingLoad <- round(rnorm(n = length(date), mean = 460, sd = 60), 0)
soreness <- round(runif(n = length(date), min = 3, max = 6), 0)
df <- data.frame(athlete, mesocycle, date, trainingLoad, soreness)

# Group by athlete and mesocycle
df %>%
  group_by(athlete, mesocycle) %>%
  mutate(trainingLoad_lag = lag(trainingLoad)) %>%
  as.data.frame()
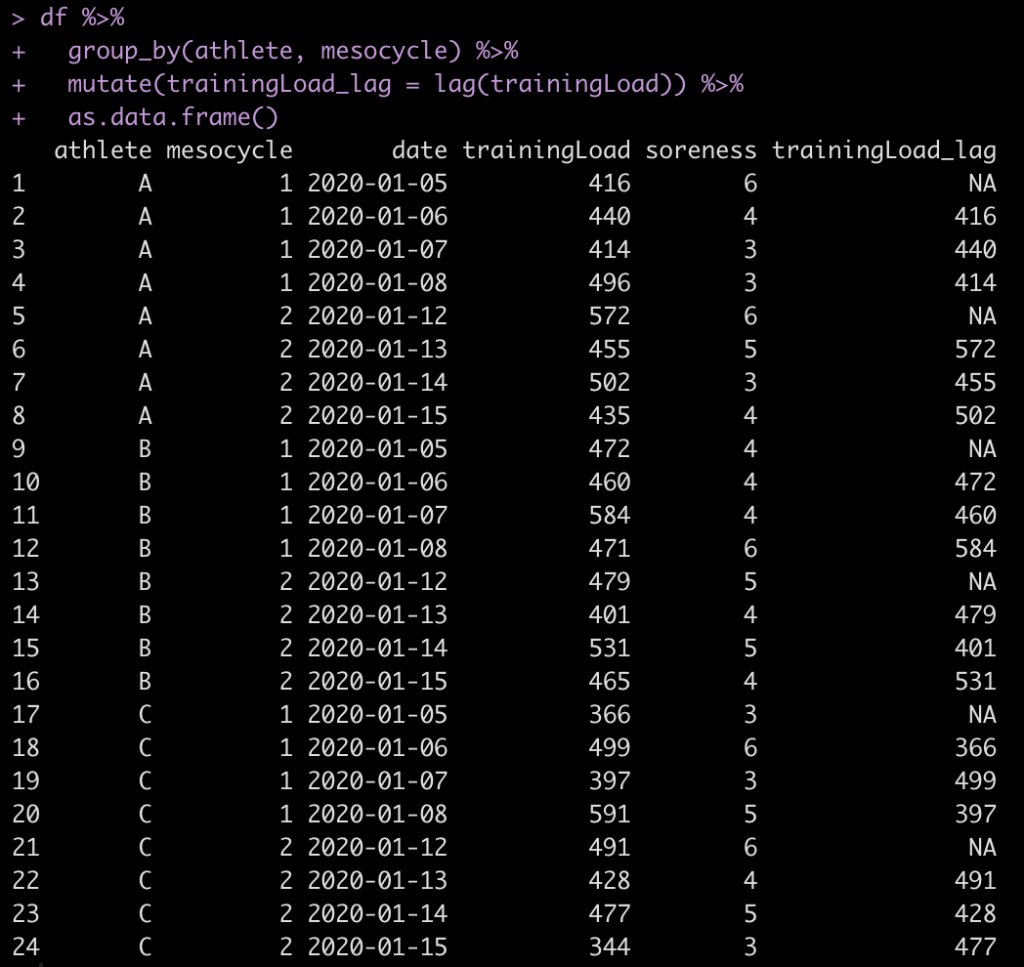
All we need to do is pass the group_by() function athlete and mesocycle and R will apply the lag() function to our training_load variable based on these parameters.
Notice that R correctly grouped by the 3 athletes and the 2 mesocycles (4 sessions per mesocycle) for each athlete. In doing so, we have an NA for the first day of each mesocycle for each athlete.
If you’d like the full code, CLICK HERE.


